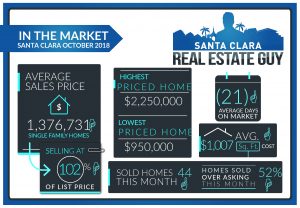
2018 October home sales in Santa Clara consisted of 44 single family homes that closed escrow, an increase from of the 32 homes sold in September. Average days on market increased to 21 days from 15 the prior month, and median days decreased to 14 from 15. The average price of a home sold in October 2018 was $1.377M which is about $41K lower than last month’s figure of $1.418M and $81k lower than the previous month at $1.458M. The Median price a home sold was $1.3M, which is $29K below September’s median price. Average cost per square foot increased from $933 per sqft. to $1,007. Of the 44 homes sold in October, 23 sold over asking. On average 1.9% over asking compared to 3.2% over asking in the previous month. Prices have settled further down and activity is still slow. Home inventory is steadily increasing which is abnormal for this time of year. Look for prices to continue to soften and drop until home inventory levels drop.
| Street Address | List Price | Price | DOM | Beds Total | Bths | Sq Ft Total | Age |
| 610 Monroe Street | $2,395,000 | $2,250,000 | 33 | 4 | 3|0 | 2,388 | 118 |
| 100 N Henry Avenue | $2,199,998 | $2,120,000 | 15 | 4 | 3|0 | 2,857 | 0 |
| 3080 Arthur Court | $1,898,888 | $1,930,000 | 10 | 3 | 2|1 | 1,729 | 22 |
| 3014 Via Siena Place | $1,888,888 | $1,925,000 | 7 | 4 | 2|1 | 1,957 | 3 |
| 2835 Ponderosa Way | $1,648,000 | $1,660,000 | 25 | 4 | 2|0 | 1,687 | 58 |
| 1326 Buchanan Drive | $1,550,000 | $1,649,000 | 10 | 4 | 2|0 | 1,973 | 58 |
| 396 Sloat Court | $1,698,800 | $1,600,000 | 45 | 3 | 2|0 | 1,513 | 60 |
| 1516 Homestead Road | $1,650,000 | $1,600,000 | 116 | 3 | 2|0 | 2,300 | 113 |
| 2980 Pruneridge Avenue | $1,588,000 | $1,599,000 | 6 | 3 | 2|0 | 1,442 | 55 |
| 3242 Colgate Avenue | $1,548,000 | $1,560,000 | 13 | 3 | 2|0 | 1,442 | 55 |
| 523 Flannery Street | $1,688,000 | $1,550,000 | 15 | 4 | 2|1 | 1,749 | 55 |
| 1893 Woodland Avenue | $1,425,000 | $1,500,000 | 21 | 3 | 2|1 | 1,485 | 63 |
| 2245 Rosita Avenue | $1,399,950 | $1,475,000 | 3 | 4 | 2|0 | 1,451 | 66 |
| 3056 Taper Avenue | $1,450,000 | $1,475,000 | 14 | 4 | 2|0 | 1,330 | 61 |
| 2653 Wallace Street | $1,299,999 | $1,470,000 | 45 | 3 | 2|0 | 1,357 | 62 |
| 616 Salberg Avenue | $1,325,000 | $1,425,000 | 7 | 3 | 2|0 | 1,166 | 64 |
| 1933 Murguia Avenue | $1,398,000 | $1,405,000 | 18 | 3 | 2|0 | 1,340 | 71 |
| 4839 Avenida De Los Arboles | $1,388,000 | $1,388,000 | 9 | 4 | 2|1 | 1,850 | 42 |
| 2080 Clark Avenue | $1,088,000 | $1,385,000 | 7 | 3 | 2|0 | 1,008 | 59 |
| 3510 Earl Drive | $1,299,000 | $1,352,000 | 14 | 4 | 2|0 | 1,590 | 62 |
| 2311 Amethyst Drive | $1,299,000 | $1,335,000 | 14 | 3 | 2|0 | 1,574 | 60 |
| 2043 Pruneridge Avenue | $1,375,000 | $1,310,000 | 33 | 3 | 2|0 | 1,584 | 82 |
| 2136 Francis Avenue | $1,199,000 | $1,300,000 | 8 | 3 | 2|0 | 1,078 | 63 |
| 1680 Los Padres Boulevard | $1,349,950 | $1,300,000 | 48 | 3 | 2|0 | 1,290 | 68 |
| 823 Monroe Street | $1,399,950 | $1,300,000 | 70 | 3 | 2|0 | 2,068 | 118 |
| 643 Hamilton Lane | $1,275,000 | $1,290,000 | 14 | 4 | 2|0 | 1,127 | 65 |
| 640 HILMAR Street | $1,299,950 | $1,287,000 | 29 | 3 | 2|0 | 1,522 | 78 |
| 2154 Sheraton Drive | $1,300,000 | $1,280,000 | 15 | 3 | 2|0 | 984 | 57 |
| 1785 Long Street | $1,148,000 | $1,261,000 | 8 | 3 | 1|0 | 1,021 | 67 |
| 2131 San Rafael Avenue | $1,288,888 | $1,234,500 | 38 | 3 | 2|0 | 1,078 | 63 |
| 2293 Talia Avenue | $1,375,000 | $1,232,550 | 56 | 3 | 2|0 | 1,080 | 64 |
| 2369 Glendenning | $1,088,000 | $1,210,000 | 9 | 3 | 1|1 | 1,131 | 65 |
| 2171 Agnew Road | $1,280,000 | $1,200,000 | 19 | 3 | 2|1 | 1,260 | 20 |
| 877 Sunlite Drive | $1,198,000 | $1,198,000 | 14 | 3 | 1|0 | 1,053 | 68 |
| 1900 Chestnut Street | $1,189,000 | $1,189,000 | 12 | 4 | 3|0 | 1,835 | 112 |
| 956 Baird Avenue | $999,000 | $1,182,375 | 10 | 4 | 2|0 | 1,466 | 57 |
| 748 Robin Drive | $1,150,000 | $1,160,000 | 11 | 3 | 1|0 | 1,052 | 68 |
| 3536 Golden State Drive | $1,049,000 | $1,125,000 | 12 | 3 | 2|0 | 1,166 | 64 |
| 2725 Newhall Street | $1,049,988 | $1,100,000 | 9 | 3 | 2|0 | 1,130 | 63 |
| 1334 Crowley Avenue | $1,199,999 | $1,100,000 | 8 | 3 | 1|0 | 1,286 | 62 |
| 1982 Graham Lane | $1,050,000 | $1,050,000 | 14 | 3 | 1|0 | 1,021 | 66 |
| 2173 Benton Street | $1,099,000 | $1,025,000 | 14 | 3 | 1|0 | 1,109 | 68 |
| 752 Los Padres Boulevard | $1,088,000 | $1,025,000 | 24 | 3 | 2|0 | 1,013 | 64 |
| 1497 Cabrillo Avenue | $999,888 | $950,000 | 50 | 3 | 1|0 | 985 | 64 |
to compare with last months:
September 2018 home sales CLICK HERE.
August 2018 home sales CLICK HERE.
July 2018 home sales CLICK HERE.
June 2018 home sales CLICK HERE.
May 2018 home sales CLICK HERE.
Check out your home’s current value online, quick and free with our new Santa Clara Home Valuation Tool.
https://SantaClara.freehomevalues.net
Planning to sell or just want to stay on top of the market, get our professional MARKET REPORTS by Altos Research. Monitor inventory, prices, and market changes.
To Sign up for Free Market Reports:


