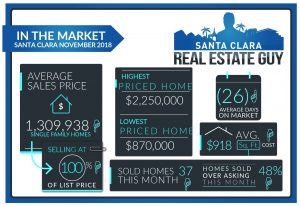
2018 November home sales in Santa Clara consisted of 37 single family homes that closed escrow, a decrease from of the 44 homes sold in October. Average days on market increased to 26 days from 21 the prior month, and median days increased to 17 from 14. The average price of a home sold in November 2018 was $1.31M which is about $67K lower than last month’s figure of $1.377M and $108k lower than the previous month at $1.418M. The Median price a home sold was $1.3M, which is the same as October’s median price. Average cost per square foot decreased from $1,007 per sqft. to $918. Of the 37 homes sold in November, 18 sold over asking. On average 0.4% over asking compared to 1.9% over asking in the previous month.
Prices have settled further down and activity is still slower as home buyers are taking their time. Home inventory has started to drop, which is typical for the holiday season. Look for prices to stay relatively firm for the holidays as inventory continues to drop as fewer homes are listed, and buyer’s absorb what good options are left.
| Street Address | List Price | Price | DOM | Beds Total | Bths | Sq Ft Total | Age |
| 52 Claremont Avenue | $2,350,000 | $2,250,000 | 55 | 4 | 3|0 | 1,980 | 62 |
| 2482 Gallup Drive | $2,396,000 | $2,205,000 | 9 | 4 | 3|1 | 3,124 | 53 |
| 441 Hillsdale Avenue | $1,988,000 | $1,988,000 | 9 | 3 | 2|0 | 1,799 | 61 |
| 4321 Marston Lane | $1,750,000 | $1,760,000 | 52 | 4 | 3|1 | 2,083 | 16 |
| 2360 Lass Drive | $1,649,000 | $1,750,878 | 14 | 4 | 3|0 | 2,326 | 21 |
| 575 N Winchester Boulevard | $1,698,000 | $1,700,000 | 10 | 4 | 4|0 | 2,679 | 12 |
| 1013 Bluebird Avenue | $1,688,000 | $1,688,000 | 56 | 3 | 2|0 | 1,388 | 57 |
| 3473 Wheeling Drive | $1,700,000 | $1,670,000 | 47 | 5 | 3|0 | 2,418 | 57 |
| 3358 Vanderbilt Way | $1,598,000 | $1,628,000 | 12 | 3 | 2|0 | 1,442 | 57 |
| 486 Birch Way | $1,649,000 | $1,560,000 | 30 | 4 | 2|1 | 2,250 | 58 |
| 2275 Talia Avenue | $1,595,000 | $1,550,000 | 5 | 4 | 2|1 | 1,599 | 66 |
| 1885 Harrison Street | $1,398,000 | $1,455,000 | 9 | 3 | 2|0 | 1,640 | 70 |
| 241 Kerry Drive | $1,499,888 | $1,450,000 | 55 | 3 | 2|0 | 1,679 | 63 |
| 933 Sunlite Drive | $1,595,000 | $1,450,000 | 41 | 4 | 3|0 | 1,835 | 69 |
| 460 Greenwood Drive | $1,299,000 | $1,400,000 | 12 | 4 | 3|0 | 1,759 | 51 |
| 3870 Eastwood Circle | $1,338,000 | $1,380,000 | 9 | 5 | 2|1 | 2,010 | 53 |
| 2520 Dixon Drive | $1,348,000 | $1,358,000 | 10 | 3 | 2|0 | 1,251 | 63 |
| 736 Fairlane Avenue | $1,225,000 | $1,350,000 | 34 | 3 | 2|0 | 1,330 | 59 |
| 4466 Lakeshore Drive | $1,299,000 | $1,320,000 | 20 | 3 | 2|0 | 1,341 | 41 |
| 2657 Barcells Avenue | $1,359,000 | $1,300,000 | 91 | 3 | 2|0 | 1,335 | 63 |
| 3545 Berry Way | $1,299,950 | $1,300,000 | 37 | 3 | 2|0 | 1,240 | 62 |
| 1846 Los Padres Boulevard | $1,299,000 | $1,299,000 | 21 | 4 | 2|0 | 1,685 | 66 |
| 3451 San Marcos Way | $1,298,000 | $1,280,000 | 17 | 3 | 2|0 | 1,464 | 64 |
| 148 Westridge Drive | $1,385,000 | $1,260,000 | 17 | 3 | 1|1 | 1,485 | 66 |
| 644 Viader Court | $1,268,000 | $1,250,000 | 21 | 3 | 1|0 | 1,216 | 71 |
| 3423 Victoria Avenue | $1,200,000 | $1,225,000 | 0 | 3 | 2|0 | 1,602 | 64 |
| 3406 Flora Vista Avenue | $1,298,888 | $1,210,000 | 13 | 3 | 2|0 | 1,561 | 64 |
| 526 Madison Street | $995,000 | $1,200,000 | 15 | 3 | 2|0 | 1,328 | 58 |
| 1424 Pacheco Street | $999,900 | $1,150,000 | 18 | 2 | 1|0 | 838 | 70 |
| 736 Woodhams Road | $1,238,888 | $1,150,000 | 8 | 3 | 2|0 | 1,108 | 64 |
| 2619 Castello Way | $1,199,999 | $1,150,000 | 81 | 4 | 2|0 | 1,109 | 58 |
| 676 Scott Boulevard | $1,080,000 | $1,125,000 | 30 | 2 | 1|0 | 936 | 71 |
| 794 Ridge Road | $1,099,900 | $1,120,000 | 8 | 3 | 2|0 | 1,329 | 63 |
| 631 Clara Vista Avenue | $1,049,888 | $1,060,000 | 9 | 3 | 1|1 | 1,145 | 61 |
| 576 Saratoga Avenue | $998,000 | $1,020,000 | 7 | 3 | 1|0 | 1,246 | 71 |
| 1174 Madison Street | $908,000 | $990,000 | 15 | 2 | 1|1 | 1,136 | 70 |
| 2107 Monroe Street | $948,888 | $870,000 | 62 | 3 | 1|0 | 985 | 64 |
October 2018 home sales CLICK HERE.to compare with last months:
September 2018 home sales CLICK HERE.
August 2018 home sales CLICK HERE.
July 2018 home sales CLICK HERE.
June 2018 home sales CLICK HERE.
May 2018 home sales CLICK HERE.
Check out your home’s current value online, quick and free with our new Santa Clara Home Valuation Tool.
https://SantaClara.freehomevalues.net
Planning to sell or just want to stay on top of the market, get our professional MARKET REPORTS by Altos Research. Monitor inventory, prices, and market changes.
To Sign up for Free Market Reports:


