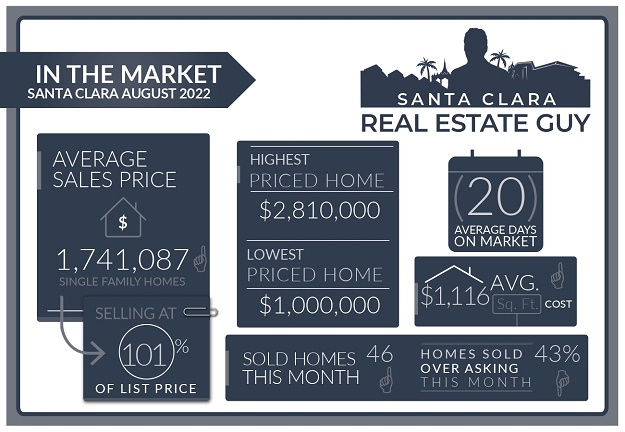
The Santa Clara housing market in August experienced 46 single-family homes that closed escrow, which is 10 more than closed escrow in the previous month of July. For some more perspective, last year there were 60 homes sold in August.
The average price of a home sold in August was $1.74M which is about $152K higher than the previous month’s figure of $1.59M. The median price home sold was $1.68M, about $60K higher than the median price in July.
The average cost per square foot saw an increase from $1109 per Sq. Ft. to $1116 per Sq. Ft. Of all the 46 homes sold in August 20 sold over the list price.
On average homes that sold did so at 1.36% over asking compared to 2.07% over asking in the previous month.
We started the month of August with 63 active single-family home listings and finished with 32 active single-family homes for sale in all of Santa Clara.
Is the Market is Rebounding?
This month’s numbers saw a rebound in pricing, but those numbers are not telling the whole story.
Yes, average and median prices are way up, but price per square foot not so much. This indicates to me that August experienced more higher end sales than July.
The market is definitely picking up. Like I mentioned in last months market update buyers seem to be jumping back in to the market after a short pause.
If you take a look at the homes that sold down below this post you will see many of the homes sold were just on the market 14 days or less.
The market has rebounded some no doubt but we are still quite a bit off from our June-July correction.
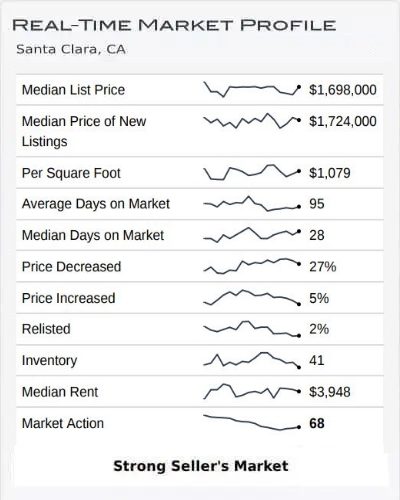
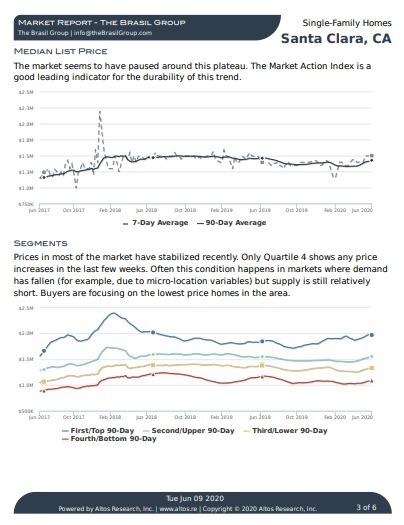
Altos Research Market Data For Santa Clara
Home Inventory is Low
We started the month with 32 homes on the market which is a bit low for September. Last year there were 36 homes on the market at the beginning of September but that was a year that saw record home price growth and a market that was pretty much strong all year.
As of the 13th of September, home inventory is hovering around 35 homes for sale in all of Santa Clara. Roughly half of those homes have been on the market for 30 days or more, but around half a dozen have had a slight price reduction.
This indicates that new listing activity has been slow and that buyers are focusing on desirable homes where they see the value. Any home that has a serious flaw or is overpriced is not receiving much activity.
Santa Clara Market Reports
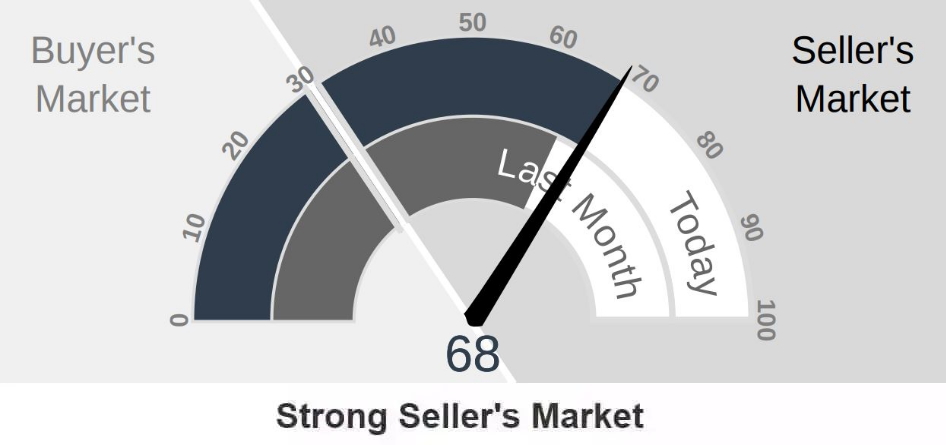
The Altos Research Market Action Index for single-family homes in Santa Clara has increased to 68 from 65 where it was last month. For more detailed reports on Santa Clara and Santa Clara Zip codes, you can access the reports here.
Santa Clara Report
95051 Report
95050 Report
95054 Report
Multiple Offers on Many Listings
Homes that are priced attractively are getting strong interest and multiple offers. Typically homes that were sold within a week or 14 days sold at asking or over asking.
If your home is priced well and buyers see the value, in this current market you are likely to receive multiple offers. These homes are selling just a bit over asking around 2-4% at the most.
For a list of sold homes in August click here or scroll down to the bottom of the page.
Other Factors in the Market:
Fed chairman Powell has pretty much squashed any hopes of a change in the short-term FED policy with his last speech.
As of now, interest rates have been creeping upward consistently and they are at around their all-time highs for the year.
The stock market rally that began at the beginning of July has all about fizzled out. Consensus is that the US will be entering a recession but many are uncertain as to how this will affect the local job market. Alphabet CEO, hinted toward job cuts as he stressed that Google will have to be more efficient.
All eyes will be on the FED in their and their next expected rate hike on September 20th. The markets have priced in a .5% increase in the federal funds rate. Anything lower and expect the markets to respond favorably anything higher and expect a sharp spike in rates and a down day on Wall Street.
Save thousands when you sell.
Includes Free Staging and Our Complete Selling Solution
* Total commission 4% including buyer side agent commission of 2.5%, offer varies by value of home.
What Can We Expect Moving Forward?
Buyers, I am still surprised that the market is showing so much resiliency here.
This says more about the sheer number of qualified buyers and lack of housing in our market. However, once the sentiment surround the local economy starts to shift I expect buyers to jump back on the side lines.
As of right now, that sentiment seems optimisitic and buyers are actively looking. Only time will tell how the bay area is affected by an overall slowing in the global economy.
As a buyer, understand that the number of homes coming on the market will drop in the coming months as we move into fall then winter.
That could make it difficult to buy a home. In normal markets this time of year would generally be affected by rising home values.
That may not be the case this year depending on how local companies respond and how confident buyers feel their job is safe.
Sellers, homes are selling and buyers are looking.
What should be a challenging slow market is quite active and full of opportunity to get a home sold.
Timing this market is going to be tricky. Conventional wisdom tells me that they market will drop in the coming months as we enter deeper into recession.
And that time to sell is sooner rather than later. But there is no predicting the FED. At some point they will have tamed inflation and will resume a policy to growth. Until then don’t expect pricing to be moving up, the likelihood is prices in the coming months will either be stable or slowly dropping.
Conclusion:
As always, whether you are buying or selling, understanding the current market and how your home relates will set you up for success. As I mentioned above some homes are doing quite well in this market.
Understand that the housing stock of Santa Clara is very diverse and can vary greatly from one neighborhood to the next.
Developing the right strategy for your specific home is critical to maximizing your ability to sell for top value.
If you have any questions about a home on the market or your home’s value, please feel free to reach out, I am happy to hear from you.
Contact Me Today
Have a question? Interested in setting an appointment to talk about your real estate plans? Contact me today.

Message Me Directly:
Message Me Directly:
Santa Clara August 2022 Home Sales
| Street Address | List Price | Price | DOM | Beds Total | Bths | Sq Ft Total | Age |
| 4289 Rivermark Parkway | $2,999,000 | $2,810,000 | 9 | 4 | 2|1 | 3,044 | 20 |
| 382 Burnett Avenue | $2,499,000 | $2,601,000 | 8 | 5 | 3|0 | 2,639 | 64 |
| 3796 Dunford Way | $2,499,000 | $2,450,000 | 4 | 3 | 2|0 | 1,503 | 61 |
| 2303 Gianera Street | $1,999,999 | $2,443,000 | 17 | 3 | 1|1 | 1,812 | 97 |
| 2636 Birchtree Lane | $2,400,000 | $2,400,000 | 14 | 3 | 2|1 | 2,179 | 52 |
| 172 Muir Avenue | $2,495,000 | $2,400,000 | 12 | 4 | 2|0 | 1,784 | 64 |
| 1053 Bluebird Avenue | $2,048,000 | $2,300,000 | 7 | 4 | 2|0 | 1,568 | 61 |
| 157 Kellogg Way | $1,899,000 | $2,180,000 | 8 | 3 | 2|0 | 1,388 | 64 |
| 272 Madrone Avenue | $1,888,000 | $2,100,000 | 6 | 4 | 2|1 | 1,749 | 59 |
| 2122 Nobili Avenue | $1,890,000 | $2,100,000 | 7 | 4 | 2|1 | 1,739 | 66 |
| 2571 Dixon Drive | $1,699,888 | $2,050,000 | 5 | 4 | 2|1 | 1,954 | 31 |
| 2365 Patricia Drive | $1,999,999 | $1,998,000 | 22 | 3 | 2|0 | 1,460 | 63 |
| 3442 Wheeling Drive | $1,888,000 | $1,930,000 | 39 | 3 | 2|0 | 1,873 | 62 |
| 71 Brian Lane | $1,995,000 | $1,880,000 | 18 | 4 | 2|0 | 1,232 | 65 |
| 1015 Capitola Way | $1,895,888 | $1,850,000 | 22 | 4 | 2|0 | 1,845 | 57 |
| 3168 Merced Court | $1,799,000 | $1,780,000 | 19 | 4 | 2|0 | 1,330 | 64 |
| 2272 Cabrillo Avenue | $1,668,000 | $1,760,000 | 6 | 3 | 2|0 | 1,512 | 68 |
| 418 Lafayette Way | $1,750,000 | $1,750,000 | 0 | 3 | 2|0 | 1,484 | 117 |
| 479 Kiely Boulevard | $1,799,888 | $1,750,000 | 19 | 3 | 2|0 | 1,442 | 62 |
| 834 Fremont Street | $1,650,000 | $1,725,000 | 12 | 3 | 2|1 | 1,785 | 29 |
| 3075 Mckinley Drive | $1,745,000 | $1,720,000 | 35 | 3 | 2|0 | 1,024 | 68 |
| 1192 Crowley Avenue | $1,699,950 | $1,715,000 | 14 | 4 | 2|0 | 1,327 | 67 |
| 945 Live Oak Drive | $1,799,950 | $1,700,000 | 35 | 4 | 3|0 | 1,860 | 58 |
| 1725 Fremont Street | $1,450,000 | $1,650,000 | 21 | 3 | 2|0 | 1,526 | 107 |
| 1231 Loyola Drive | $1,499,000 | $1,610,000 | 5 | 3 | 2|0 | 1,957 | 66 |
| 1361 Lincoln Street | $1,599,000 | $1,600,000 | 9 | 3 | 2|0 | 1,616 | 86 |
| 3043 Homestead Road | $1,600,000 | $1,600,000 | 0 | 4 | 3|0 | 1,461 | 6 |
| 963 Sunlite Drive | $1,499,000 | $1,580,000 | 7 | 3 | 2|0 | 1,582 | 73 |
| 1545 Farmer Pl | $1,628,000 | $1,575,000 | 29 | 3 | 4|0 | 1,998 | 13 |
| 2260 Menzel Place | $1,599,888 | $1,570,000 | 55 | 3 | 2|0 | 1,591 | 68 |
| 663 Starr Court | $1,682,000 | $1,570,000 | 7 | 3 | 2|0 | 1,377 | 67 |
| 2309 Cimarron Drive | $1,449,000 | $1,530,000 | 53 | 4 | 2|0 | 1,771 | 54 |
| 2053 Roth Place | $1,499,000 | $1,530,000 | 8 | 3 | 3|0 | 1,935 | 29 |
| 3491 Shafer Drive | $1,525,000 | $1,510,000 | 43 | 3 | 2|0 | 1,504 | 68 |
| 2102 Payne Place | $1,560,000 | $1,500,000 | 56 | 4 | 2|1 | 2,000 | 15 |
| 4668 Wilcox Avenue | $1,480,000 | $1,450,000 | 62 | 4 | 2|1 | 1,685 | 24 |
| 2560 Monroe Street | $1,488,000 | $1,450,000 | 6 | 3 | 2|0 | 1,367 | 60 |
| 2105 Corte Primavera | $1,399,950 | $1,400,000 | 22 | 3 | 2|0 | 1,140 | 46 |
| 3492 Flora Vista Avenue | $1,499,950 | $1,400,000 | 52 | 3 | 2|0 | 1,608 | 68 |
| 2329 Forbes Avenue | $1,499,950 | $1,350,000 | 54 | 3 | 1|1 | 1,425 | 65 |
| 3285 Machado Avenue | $1,399,000 | $1,330,000 | 28 | 3 | 2|0 | 1,078 | 67 |
| 2607 Landslide Court | $1,199,999 | $1,170,000 | 19 | 3 | 1|0 | 897 | 67 |
| 2566 Dixon Drive | $1,100,000 | $1,165,000 | 7 | 3 | 2|0 | 1,166 | 67 |
| 1757 Monroe Street | $1,098,888 | $1,100,000 | 3 | 2 | 1|0 | 984 | 80 |
| 2107 Main Street | $998,000 | $1,058,000 | 13 | 3 | 1|0 | 985 | 68 |
| 1865 Catherine Street | $1,199,950 | $1,000,000 | 14 | 3 | 1|0 | 1,230 | 76 |
Santa Clara Housing Market Archive
August 2022 home sales CLICK HERE.
July 2022 home sales CLICK HERE.
June 2022 home sales CLICK HERE.
April 2022 home sales CLICK HERE.
March 2022 home sales CLICK HERE.
February 2022 home sales CLICK HERE.
December 2021 home sales CLICK HERE.
November 2021 home sales CLICK HERE.
October 2021 home sales CLICK HERE.
September 2021 home sales CLICK HERE.
July 2021 home sales CLICK HERE.
May 2021 home sales CLICK HERE.
April 2021 home sales CLICK HERE.
March 2021 home sales CLICK HERE.
February 2021 home sales CLICK HERE.
January 2021 home sales CLICK HERE.
November 2020 home sales CLICK HERE.
October 2020 home sales CLICK HERE.
September 2020 home sales CLICK HERE.
August 2020 home sales CLICK HERE.
July 2020 home sales CLICK HERE.
June 2020 home sales CLICK HERE.
May 2020 home sales CLICK HERE.
April 2020 home sales CLICK HERE.
March 2020 home sales CLICK HERE.
January 2020 home sales CLICK HERE.
