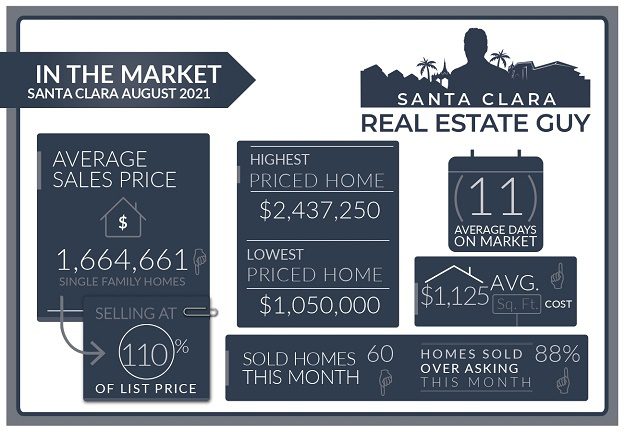
The Santa Clara housing market in August experienced 60 single-family homes that closed escrow, which is 22 less than closed escrow in the previous month of July.
The average price of a home sold in August was $1.66M which is about $55K lower than last month’s figure of $1.72M. The median price home sold was $1.60M, about $70K lower than July’s median price.
The average cost per square foot had a slight increase from $1073 per Sq. Ft. to $1125 per Sq. Ft. Of the 60 homes sold in August, 53 sold over the list price.
On average homes that sold did so at 9.71% over asking compared to 8.38% over asking in the previous month.
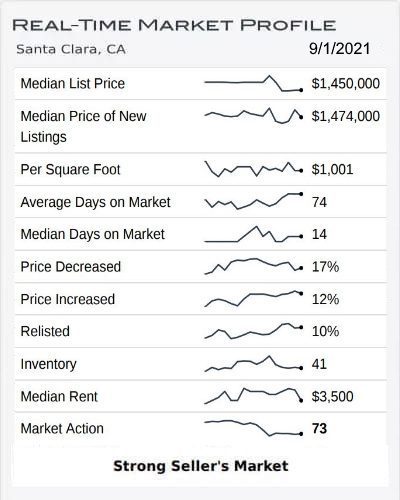
We started the month of August with 42 active single-family home listings and finished with 36 single family homes for sale in all of Santa Clara.
The Summer Santa Clara Real Estate Market
Typically every Summer the local housing market slows down.
That wasn’t the case year. We experienced a high number of transactions in July and throughout the Summer homes were selling rather quickly and many over list price.
August sales saw a dip in median and average pricing, but an increase in price for sq. ft., which to me indicates that there were a higher number of smaller homes and properties sold in August than July.
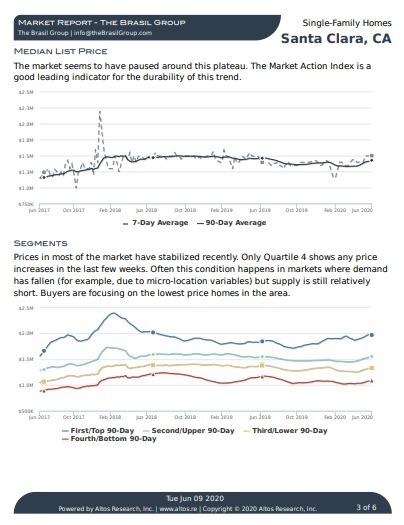
In regards to home values, there wasn’t much substantial gains during the Summer so pricing on average stayed relatively stable. The exception was for homes in higher sought after areas and neighborhoods, or updated and remodeled homes. Which continued to make new highs with lots of offers and interest from buyers.
Altos Research Market Data For Santa Clara
What's Happening to Inventory of Homes for Sale:
Inventory continues to be low, and has dropped in recent weeks from Summer highs.
At the highest point this year we may have reached around 50 single-family homes for sale. Historically we typically will get into the 60s and 70s and the market will really show signs of a significant slowdown.
That wasn’t the case this Summer. Buying activity was hot and continued to be so, and at no point did inventory of homes for sale ever really overtake the demand.
Current inventory levels have now dropped to around 35-40 single-family homes. Townhomes and condos have remained steady around 60 homes, and that market has been considerably different than the single-family home market.
Santa Clara Market Reports
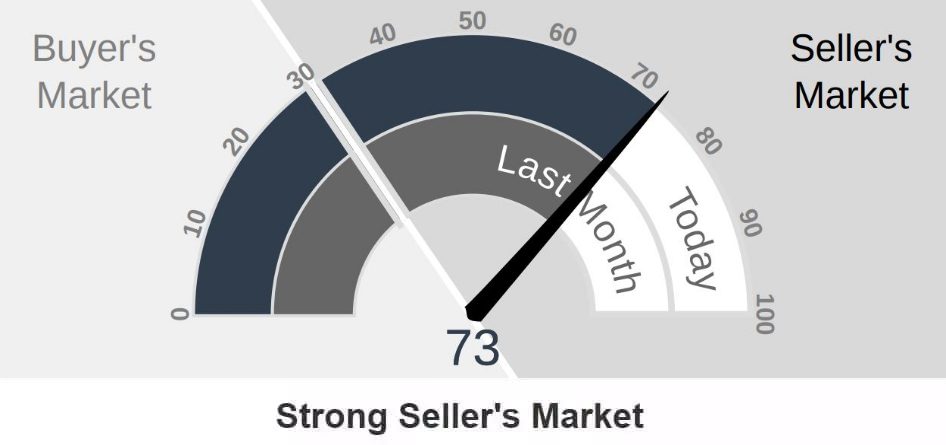
The Altos Research Market Action Index for single-family homes in Santa Clara has decreased to 73 from 74 where it was last month. For more detailed reports on Santa Clara and Santa Clara Zip codes, you can access the reports here.
Santa Clara Report
95051 Report
95050 Report
95054 Report
Seasonal Trends:
As we move into the Fall market, the trend is that inventory will start to wane and the market will tighten as we head into the holiday months.
This of course, is good for sellers and if you are a buyer, there will be less properties, so less options and likely more competition.
An interesting phenomenon I am noticing this year that I have not noticed in previous years is that although the market is tight and prices have appreciated significantly there remains a number of homes on the market that are not selling.
These are typically homes in poor locations such as busy streets, poor condition, or posses some undesirable trait that puts off buyers. In hot markets like the one we are experiencing these homes typically do end up selling.
It seems as though that is not the trend in this current market. Home buyers are passing on these properties, and there are a number of homes on the market that have been listed for more than a month.
Other Factors in the Market:
The buying of course is being fueled by low mortgage rates and strong stock prices.
Mortgage rates continue to hover at all time lows while the stock market is trending upward.
As the economy is heating up we would expect the FED to raise rates and there is talk of halting or slowing “quantitative easing” but nothing has been determined.
So assuming nothing changes, I would expect buyer demand to remain strong.
Since buyers now have more options on where they can live, the market is behaving differently from past hot markets.
People are willing to live farther to get what they want and compromising on convenience. This has really affected certain segments of the market and housing.
Save thousands when you sell.
Includes Free Staging and Our Complete Selling Solution
* Total commission 4% including buyer side agent commission of 2.5%, offer varies by value of home.
What Can We Expect Moving Forward?
Buyers, home demand is high and inventory of homes for sale is slowing, these are sure signs that pricing will not be dropping and may in fact increase in the next few months.
There are still a fair amount of buyers out there, but they are still picky.
Also buyers have other options and they haven’t ruled those options out.
As a buyer in this market, it’s important to understand what you are looking for and how that segment is performing and will perform moving forward.
If anything this current market has shown what can happen if you make a poor real estate decision, as those homes have really trailed in this current market.
Sellers, home values have held up well and inventory is once again dropping.
As a seller you can basically pick your time to sell in this market.
Keep in mind that there are segments of the market that are not performing well. It’s important to understand how your home relates to the market. Is it a home that will sell well AS-IS or do you really need to consider improving your home to get is sold.
This is crucial to determining the right strategy to getting your home sold for top value.
You don’t want to be that home that buyers are passing on while the other homes are selling.
Conclusion:
As always, whether you are buying or selling, be sure to understand how your home or the property you are considering ranks in the current market. Understanding the Santa Clara housing market is important when determining the right price and a solid home investment.
If you have any questions about a home on the market or your home’s value, please feel free to reach out, I am happy to hear from you.
Contact Me Today
Have a question? Interested in setting an appointment to talk about your real estate plans? Contact me today.
-
VINICIUS BRASIL, Realtor
Keller Williams - The Brasil Group
19400 Stevens Creek Blvd #200
Cupertino, CA 95014 - 408.582.3272
- Schedule a meeting

Message Me Directly:
Santa Clara August 2021 Home Sales
| Street Address | List Price | Price | DOM | Beds Total | Bths | Sq Ft Total | Age |
| 2252 Nobili Avenue | $1,988,000 | $2,437,250 | 9 | 4 | 3|0 | 2,235 | 64 |
| 330 Hillsdale Avenue | $1,889,000 | $2,400,000 | 8 | 3 | 2|0 | 1,284 | 64 |
| 626 Giannini Drive | $2,125,000 | $2,250,000 | 9 | 3 | 2|0 | 1,870 | 65 |
| 3815 Pruneridge Avenue | $2,188,000 | $2,241,000 | 13 | 4 | 2|0 | 2,075 | 62 |
| 563 Hubbard Avenue | $2,049,000 | $2,175,000 | 30 | 4 | 2|0 | 1,523 | 62 |
| 985 Capitola Way | $1,989,000 | $2,160,000 | 7 | 5 | 3|1 | 2,633 | 57 |
| 744 Yale Lane | $1,758,888 | $2,150,000 | 7 | 6 | 3|0 | 2,511 | 60 |
| 2854 Forbes Avenue | $1,788,888 | $2,100,000 | 7 | 4 | 2|1 | 1,749 | 61 |
| 2640 Tuliptree Lane | $1,800,000 | $2,100,000 | 8 | 3 | 2|1 | 1,927 | 49 |
| 815 Pepper Tree Lane | $1,699,950 | $2,060,000 | 1 | 4 | 2|0 | 1,940 | 65 |
| 2694 Elliot Street | $1,750,000 | $2,055,000 | 6 | 3 | 2|0 | 1,800 | 62 |
| 671 Hillsdale Avenue | $1,898,000 | $2,050,000 | 4 | 4 | 2|0 | 1,638 | 65 |
| 3572 Elmhurst Avenue | $1,899,000 | $2,030,000 | 0 | 3 | 2|0 | 1,401 | 64 |
| 2520 Malone Pl | $1,850,000 | $1,965,000 | 25 | 4 | 3|0 | 1,709 | 64 |
| 2139 Briarwood Drive | $1,600,000 | $1,950,000 | 6 | 3 | 2|0 | 1,410 | 65 |
| 3414 Notre Dame Drive | $1,629,000 | $1,945,000 | 6 | 3 | 2|0 | 1,374 | 64 |
| 641 Woodhams Road | $1,699,000 | $1,930,000 | 7 | 3 | 2|0 | 1,447 | 60 |
| 3435 Notre Dame Drive | $1,599,000 | $1,861,000 | 7 | 3 | 2|0 | 1,374 | 62 |
| 3520 Pruneridge Avenue | $1,588,000 | $1,850,000 | 12 | 4 | 3|0 | 1,525 | 63 |
| 2973 Howell Avenue | $1,688,800 | $1,850,000 | 7 | 3 | 2|0 | 1,833 | 66 |
| 641 Hilmar | $1,748,000 | $1,770,000 | 9 | 4 | 3|0 | 2,122 | 82 |
| 1067 Las Palmas Drive | $1,649,000 | $1,702,000 | 7 | 3 | 2|0 | 1,409 | 66 |
| 2553 Gallup Drive | $1,598,900 | $1,700,000 | 7 | 3 | 2|0 | 1,548 | 56 |
| 2991 Pruneridge Avenue | $1,675,000 | $1,700,000 | 56 | 4 | 2|1 | 1,749 | 61 |
| 611 Hilmar Street | $1,700,000 | $1,680,000 | 34 | 6 | 5|0 | 1,810 | 65 |
| 2141 Avenida De Las Flores | $1,549,000 | $1,650,000 | 13 | 4 | 2|1 | 1,850 | 45 |
| 4153 Tobin Circle | $1,555,888 | $1,630,000 | 18 | 3 | 3|1 | 1,657 | 18 |
| 1116 Buchanan Drive | $1,395,000 | $1,616,000 | 3 | 3 | 2|0 | 1,329 | 61 |
| 2261 Bowers Avenue | $1,298,000 | $1,610,000 | 8 | 3 | 2|0 | 1,315 | 61 |
| 629 Barto Street | $1,388,000 | $1,600,000 | 8 | 3 | 2|0 | 1,127 | 68 |
| 838 Hilmar Street | $1,700,000 | $1,600,000 | 48 | 4 | 2|1 | 2,264 | 80 |
| 2039 Jamison Place | $1,550,000 | $1,560,000 | 17 | 3 | 3|0 | 1,935 | 28 |
| 4495 Fillmore Street | $1,348,000 | $1,550,000 | 8 | 4 | 2|0 | 1,760 | 62 |
| 735 Los Padres Boulevard | $1,450,000 | $1,550,000 | 5 | 3 | 2|0 | 1,205 | 67 |
| 2141 Sheraton Drive | $1,298,800 | $1,540,000 | 5 | 4 | 2|0 | 1,248 | 60 |
| 3534 Shafer | $1,599,000 | $1,535,000 | 0 | 5 | 3|0 | 2,303 | 67 |
| 385 Crestview Drive | $1,479,000 | $1,525,000 | 17 | 4 | 2|0 | 1,469 | 65 |
| 2205 Talia Avenue | $1,349,888 | $1,500,000 | 2 | 3 | 1|0 | 1,484 | 69 |
| 1137 Chapel Drive | $1,399,000 | $1,500,000 | 3 | 3 | 1|0 | 1,339 | 72 |
| 4453 Fuller Street | $1,389,000 | $1,485,000 | 8 | 4 | 2|0 | 1,584 | 44 |
| 2155 Laurel Drive | $1,299,000 | $1,480,000 | 5 | 3 | 1|0 | 1,053 | 70 |
| 3059 Monroe Street | $1,288,000 | $1,475,000 | 10 | 3 | 2|0 | 1,250 | 66 |
| 2009 Francis Avenue | $1,350,000 | $1,470,000 | 6 | 4 | 2|0 | 1,095 | 61 |
| 642 Laurie Avenue | $1,249,950 | $1,450,888 | 7 | 3 | 2|0 | 1,280 | 57 |
| 937 Las Palmas Drive | $1,288,000 | $1,420,000 | 36 | 3 | 2|0 | 1,166 | 66 |
| 2301 Bowers Avenue | $1,299,000 | $1,400,000 | 4 | 3 | 2|0 | 1,243 | 61 |
| 1365 Main Street | $1,499,000 | $1,375,000 | 2 | 3 | 2|0 | 1,375 | 96 |
| 835 Monroe Street | $1,398,888 | $1,370,000 | 34 | 4 | 2|1 | 1,840 | 13 |
| 2343 Vargas Place | $1,100,000 | $1,355,000 | 6 | 3 | 2|0 | 1,053 | 67 |
| 1168 Block Drive | $1,298,000 | $1,350,000 | 6 | 3 | 2|0 | 1,087 | 70 |
| 2273 Pruneridge Avenue | $1,334,000 | $1,350,000 | 13 | 3 | 2|0 | 1,075 | 69 |
| 467 Los Padres Boulevard | $1,150,000 | $1,275,000 | 4 | 3 | 1|0 | 1,075 | 69 |
| 2254 Augusta Place | $1,250,000 | $1,275,000 | 40 | 3 | 2|0 | 1,095 | 63 |
| 759 Clara Vista Avenue | $1,000,000 | $1,261,500 | 7 | 3 | 2|0 | 1,013 | 67 |
| 2131 3rd Street | $1,329,000 | $1,250,000 | 22 | 4 | 2|1 | 1,705 | 21 |
| 3359 Victoria Avenue | $1,198,998 | $1,210,000 | 10 | 3 | 1|0 | 1,068 | 67 |
| 1463 Jackson Street | $995,000 | $1,200,000 | 1 | 3 | 1|1 | 1,222 | 97 |
| 763 Layton Street | $1,200,000 | $1,200,000 | 0 | 3 | 2|0 | 1,230 | 67 |
| 1743 Jackson Street | $998,000 | $1,100,000 | 13 | 3 | 2|0 | 1,000 | 73 |
| 733 Park Court | $999,950 | $1,050,000 | 7 | 2 | 1|0 | 886 | 97 |
Santa Clara Housing Market Archive
July 2021 home sales CLICK HERE.
May 2021 home sales CLICK HERE.
April 2021 home sales CLICK HERE.
March 2021 home sales CLICK HERE.
February 2021 home sales CLICK HERE.
January 2021 home sales CLICK HERE.
November 2020 home sales CLICK HERE.
October 2020 home sales CLICK HERE.
September 2020 home sales CLICK HERE.
August 2020 home sales CLICK HERE.
July 2020 home sales CLICK HERE.
June 2020 home sales CLICK HERE.
May 2020 home sales CLICK HERE.
April 2020 home sales CLICK HERE.
March 2020 home sales CLICK HERE.
January 2020 home sales CLICK HERE.
