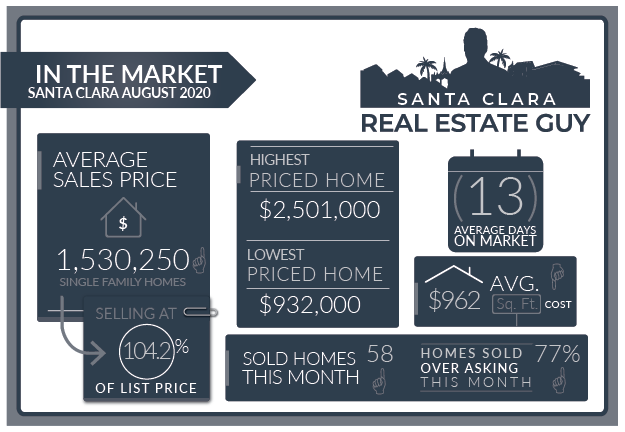
The Santa Clara housing market in August experienced 58 single-family homes that closed escrow, which was more than the 53 which sold in July.
During August there were 68 homes that accepted contracts an increase from the prior month’s 59 homes. During the month there were 74 new active listings that came on the market.
The average price of a home sold in August was $1.53M which is about $20K higher than last month’s figure of $1.51M. The Median price home sold was $1.48M, which is about $20K lower than July’s median price.
The average cost per square foot decreased from $966 per Sq. Ft. to $962. Of the 58 homes sold in August, 45 sold over asking.
On average homes that sold, sold 4.17% over asking compared to 2.61% over asking in the previous month.
We started the month of August with 51 active single-family home listings and finished with at the same level with 51 in all of Santa Clara.
August, which is typically a slower month for sales in the Summer we saw an increase over July as the market continues to heat up with more buyers.
The slow spring may be responsible as we are seeing more transactions happening this time of year. Although there are more listings coming up buyers are keeping up with new inventory and multiple offers situations are becoming more frequent.
Last month we saw an increase of the percentage that sold homes are selling over asking, another indicator of a stronger sellers market.
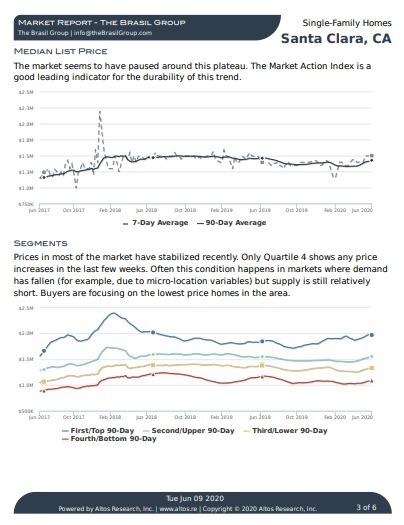
Altos Research Market Data For Santa Clara
In September we are still noticing inventory operating in a range of 45 to 55 homes on the market, at one point it reached 60 homes but dropped back down. As of today 9/12/2020 there are 47 homes listed for sale in Santa Clara.
Homes in good neighborhoods, and locations are selling quickly with multiple offers while some homes on busy streets or that have other adverse characteristics are still lingering on the market.
Santa Clara Market Reports
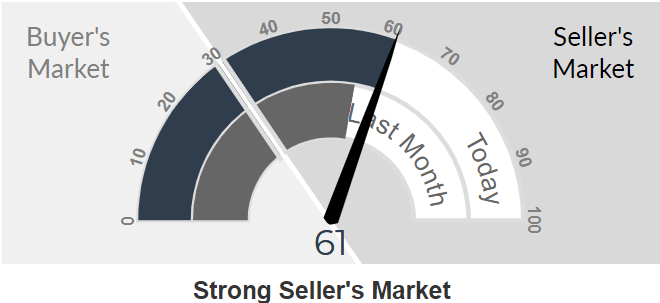
The Altos Research Market Action Index for single-family homes in Santa Clara has increased to 61 from 55 where it was last month. For more detailed reports on Santa Clara and Santa Clara Zip codes, you can access the reports here.
Santa Clara Report
95051 Report
95050 Report
95054 Report
The Altos Market Action Index (MAI) continues to trend upward gradually another indicator that the market is becoming a stronger sellers market.
Remember that September can be a transition month where we move from the Summer market to the Fall market with dropping inventory. With so many changes this year its difficult to predict if we will follow the same pattern of lower inventory in the Fall and a tighter market for buyers.
Buyers, be sure to be clear on your objectives and don’t overlook homes that may not be updated but are good buys. Such as homes in sought after neighborhoods, good layouts and in desirable locations.
Sellers, with lower inventory and strong buyer demand, the market continues to favor listings . Homes are seeing more and more multiple offers and selling faster than previous months.
Be sure to understand how your home fits in the current market, so you know what improvements you need to make if any to get your home sold quickly and for a great price.
If you have any questions about a home on the market or your home’s value, please feel free to reach out I am happy to hear from you.
Santa Clara Home Sales August 2020
| Street Address | List Price | Price | DOM | Beds Total | Bths | Sq Ft Total | Age |
| 3671 Warbler Avenue | $2,388,000 | $2,501,000 | 11 | 3 | 2|1 | 2,350 | 25 |
| 190 Arcadia Avenue | $2,299,950 | $2,350,000 | 25 | 4 | 2|1 | 2,432 | 7 |
| 947 Wood Duck Avenue | $2,095,000 | $2,070,000 | 34 | 4 | 2|1 | 2,701 | 27 |
| 4235 Stewart Lane | $1,930,000 | $1,971,000 | 7 | 4 | 2|1 | 2,627 | 18 |
| 121 Brian Lane | $1,798,000 | $1,865,000 | 10 | 3 | 3|0 | 1,505 | 63 |
| 470 Norwood Circle | $1,898,000 | $1,850,000 | 10 | 4 | 2|1 | 2,104 | 13 |
| 535 Barto Street | $1,765,000 | $1,850,000 | 9 | 3 | 2|0 | 1,645 | 57 |
| 2951 Miles Drive | $1,699,000 | $1,810,000 | 7 | 3 | 2|0 | 1,662 | 63 |
| 1430 Madison Street | $1,848,000 | $1,810,000 | 74 | 4 | 3|0 | 2,064 | 0 |
| 2369 Fordham Drive | $1,799,000 | $1,785,000 | 7 | 5 | 3|0 | 2,088 | 63 |
| 653 Los Olivos Drive | $1,650,000 | $1,760,000 | 8 | 4 | 3|0 | 1,862 | 65 |
| 660 Nazareth Court | $1,650,000 | $1,750,000 | 4 | 3 | 2|1 | 1,773 | 60 |
| 2466 Armstrong Place | $1,588,000 | $1,728,000 | 7 | 4 | 2|0 | 1,885 | 65 |
| 477 Luther Drive | $1,499,000 | $1,715,000 | 3 | 4 | 2|0 | 1,442 | 60 |
| 2584 Bonnie Drive | $1,548,000 | $1,710,000 | 8 | 5 | 2|1 | 2,149 | 48 |
| 3223 Colgate Avenue | $1,600,000 | $1,700,000 | 6 | 3 | 2|0 | 1,482 | 57 |
| 2960 Mark Avenue | $1,700,000 | $1,695,000 | 68 | 5 | 3|0 | 2,272 | 63 |
| 2089 Fordham Drive | $1,498,000 | $1,688,888 | 11 | 3 | 2|0 | 1,425 | 61 |
| 3042 Via Siena Place | $1,668,000 | $1,680,000 | 0 | 3 | 2|1 | 1,762 | 5 |
| 2236 Duvall Court | $1,598,800 | $1,675,000 | 10 | 4 | 3|0 | 2,223 | 22 |
| 771 Fairlane Avenue | $1,538,888 | $1,635,000 | 25 | 4 | 2|0 | 1,651 | 61 |
| 3157 Dallas Court | $1,598,000 | $1,620,000 | 50 | 4 | 3|0 | 1,910 | 62 |
| 2462 Gallup Drive | $1,449,888 | $1,620,000 | 10 | 4 | 2|0 | 1,693 | 55 |
| 3458 Flora Vista Avenue | $1,599,000 | $1,610,000 | 25 | 4 | 3|0 | 1,510 | 66 |
| 1489 Oliver Place | $1,499,000 | $1,568,000 | 13 | 4 | 4|0 | 2,004 | 15 |
| 3658 Eastwood Circle | $1,445,000 | $1,535,000 | 10 | 4 | 3|0 | 1,666 | 51 |
| 1276 Buchanan Drive | $1,495,000 | $1,520,000 | 8 | 4 | 2|0 | 1,418 | 60 |
| 1791 Briarwood Drive | $1,358,888 | $1,510,000 | 2 | 3 | 2|0 | 1,212 | 66 |
| 2513 Ramke Place | $1,398,889 | $1,485,000 | 5 | 3 | 2|0 | 1,340 | 63 |
| 598 Bancroft Street | $1,498,800 | $1,485,000 | 32 | 4 | 2|0 | 1,651 | 61 |
| 3538 Druffel Place | $1,398,000 | $1,480,000 | 13 | 3 | 3|1 | 1,839 | 10 |
| 2904 Butte Street | $1,497,000 | $1,475,000 | 3 | 3|0 | 1,512 | 73 | |
| 2960 Jerald Avenue | $1,425,000 | $1,460,000 | 12 | 4 | 2|0 | 1,330 | 64 |
| 1457 Los Padres Boulevard | $1,298,000 | $1,427,000 | 4 | 3 | 1|1 | 1,347 | 64 |
| 1078 Fairfield Avenue | $1,350,000 | $1,420,000 | 6 | 3 | 2|0 | 1,414 | 68 |
| 2811 Fargher Drive | $1,388,000 | $1,415,000 | 9 | 3 | 2|1 | 1,639 | 31 |
| 2182 Bowers Avenue | $1,349,000 | $1,414,000 | 6 | 3 | 2|0 | 1,207 | 61 |
| 878 Leith Avenue | $1,299,000 | $1,410,000 | 6 | 3 | 3|0 | 1,628 | 59 |
| 2774 Barkley Avenue | $1,400,000 | $1,410,000 | 0 | 4 | 2|0 | 1,330 | 64 |
| 4170 Tobin Circle | $1,399,800 | $1,405,000 | 0 | 3 | 3|0 | 1,590 | 18 |
| 413 Greenwood Drive | $1,395,000 | $1,405,000 | 14 | 4 | 2|0 | 1,666 | 51 |
| 2530 Forbes Avenue | $1,349,888 | $1,400,000 | 8 | 3 | 2|0 | 1,648 | 63 |
| 681 Marshall Court | $1,199,000 | $1,380,000 | 3 | 3 | 1|0 | 1,124 | 66 |
| 1972 Harrison Street | $1,348,000 | $1,365,000 | 5 | 3 | 1|1 | 1,601 | 72 |
| 2043 Larsen Court | $1,399,950 | $1,335,000 | 24 | 6 | 3|0 | 1,770 | 62 |
| 290 Alviso Street | $1,188,000 | $1,305,000 | 1 | 2 | 1|0 | 1,300 | 120 |
| 1168 Las Palmas Drive | $1,250,000 | $1,300,000 | 3 | 3 | 2|0 | 1,380 | 65 |
| 143 Brookside Avenue | $1,300,000 | $1,300,000 | 26 | 4 | 3|0 | 1,400 | 80 |
| 1875 De La Pena Avenue | $1,299,950 | $1,260,000 | 10 | 3 | 2|0 | 1,483 | 73 |
| 1145 Market Street | $1,050,000 | $1,255,000 | 6 | 3 | 2|0 | 1,088 | 83 |
| 628 San Miguel Avenue | $1,200,000 | $1,230,000 | 4 | 2 | 2|0 | 1,080 | 63 |
| 975 Hilmar Street | $1,255,000 | $1,155,000 | 18 | 3 | 2|0 | 1,868 | 67 |
| 2663 Wallace Street | $999,888 | $1,140,000 | 6 | 3 | 1|0 | 900 | 64 |
| 4680 Wilcox Avenue | $1,098,000 | $1,135,000 | 16 | 3 | 2|1 | 1,351 | 22 |
| 2605 Painted Rock Drive | $1,050,000 | $1,050,000 | 24 | 4 | 2|0 | 1,447 | 66 |
| 1425 Benton Street | $999,000 | $999,000 | 6 | 2 | 1|0 | 1,080 | 79 |
| 643 Scott Boulevard | $899,000 | $938,000 | 7 | 2 | 1|0 | 990 | 73 |
| 1485 Walnut Grove Avenue | $899,950 | $932,000 | 6 | 2 | 1|0 | 924 | 74 |
Contact Me Today
Have a question? Interested in setting an appointment to talk about your real estate plans? Contact me today.
-
VINICIUS BRASIL, Realtor
Keller Williams - The Brasil Group
19400 Stevens Creek Blvd #200
Cupertino, CA 95014 - 408.582.3272
- Schedule a meeting
Santa Clara Housing Market Archive
August 2020 home sales CLICK HERE.
July 2020 home sales CLICK HERE.
June 2020 home sales CLICK HERE.
May 2020 home sales CLICK HERE.
April 2020 home sales CLICK HERE.
March 2020 home sales CLICK HERE.
January 2020 home sales CLICK HERE.
December 2019 home sales CLICK HERE.
November 2019 home sales CLICK HERE.
October 2019 home sales CLICK HERE.
September 2019 home sales CLICK HERE.
August 2019 home sales CLICK HERE.
July 2019 home sales CLICK HERE.
June 2019 home sales CLICK HERE.
May 2019 home sales CLICK HERE.
April 2019 home sales CLICK HERE.
March 2019 home sales CLICK HERE.
February 2019 home sales CLICK HERE.
January 2019 home sales CLICK HERE.
December 2018 home sales CLICK HERE.
November 2018 home sales CLICK HERE.
October 2018 home sales CLICK HERE.
September 2018 home sales CLICK HERE.
August 2018 home sales CLICK HERE.
July 2018 home sales CLICK HERE.
June 2018 home sales CLICK HERE.
May 2018 home sales CLICK HERE.
