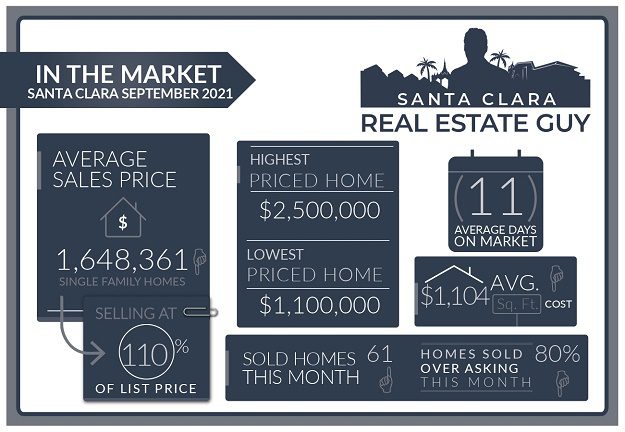
The Santa Clara housing market in September experienced 61 single-family homes that closed escrow, which is 1 more than the previous month of August.
The average price of a home sold in September was $1.65M which is about $16K lower than last month’s figure of $1.66M. The median price home sold was $1.65M, about $50K higher than the median price in August.
The average cost per square foot saw a slight decrease from $1125 per Sq. Ft. to $1104 per Sq. Ft. Of the 61 homes sold in September, 49 sold over the list price.
On average homes that sold did so at 9.49% over asking compared to 9.71% over asking in the previous month.
We started the month of September with 36 active single-family home listings and finished with 35 single family homes for sale in all of Santa Clara.
The Fall Santa Clara Real Estate Market
Home values are holding up which is typically is the case in the Fall when the inventory of homes starts to drop.
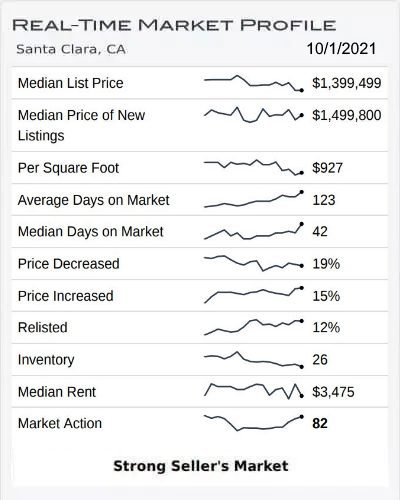
Currently in Santa Clara there are about 25 homes on the market down from 36 homes just two weeks ago.
Demand for homes in sought-after neighborhoods and locations is still high. Those homes are typically selling quickly, with multiple offers, and over list price.
Also more than half of the available inventory of homes has only been on the market for 10 days or less.
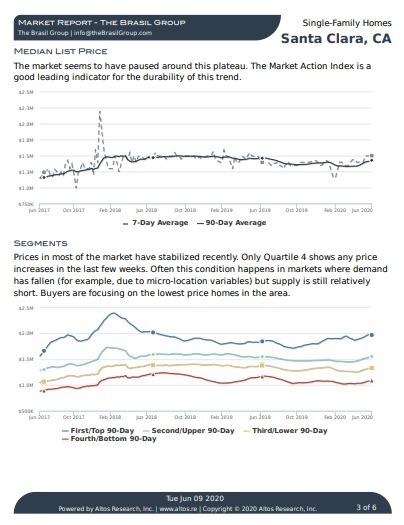
Altos Research Market Data For Santa Clara
What's Happening to Inventory of Homes for Sale:
Inventory of homes for sale continues to drop, and if you have been following my market updates you will know that low inventory will likely lead to rising home values.
While this Summer’s inventory levels never reached a point where homes started to sit on the market, it looks as though we may reach a point of extremely low inventory in the months ahead.
Current inventory levels have now dropped to around 25 single-family homes. Townhomes and condos are around 45 homes on the market.
Santa Clara Market Reports
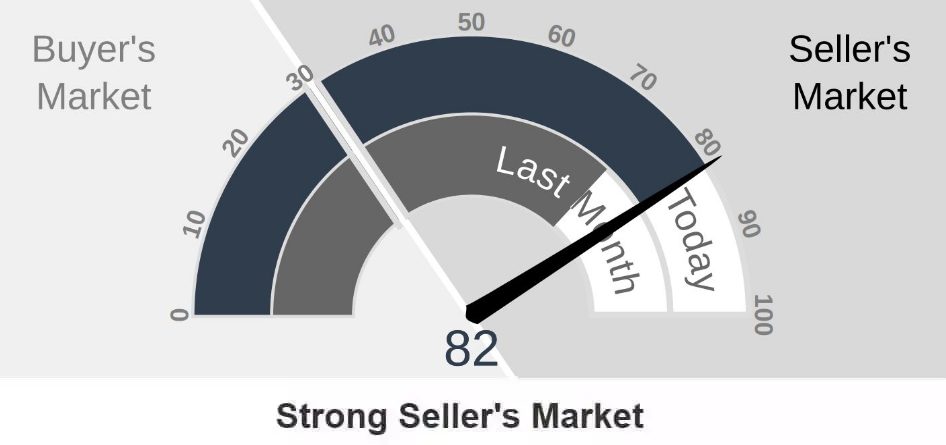
The Altos Research Market Action Index for single-family homes in Santa Clara has increased to 82 from 73 where it was last month. For more detailed reports on Santa Clara and Santa Clara Zip codes, you can access the reports here.
Santa Clara Report
95051 Report
95050 Report
95054 Report
Seasonal Trends:
The Fall market marks a transition to the winter or holiday season. Typically inventory will start to drop, at first gradually but as we get closer to Thanksgiving and December we start to see very low numbers of home’s for sale.
Low inventory levels are of course, good for sellers. If you are a buyer, there will be less properties which equates to less options and likely more competition.
With only 25 single-family homes on the market in October, and very few of those homes in great locations, this Fall and Winter season are likely to present challenges for buyers and opportunity for sellers.
Other Factors in the Market:
Mortgage rates have started to rise in the last few weeks. Rates are still extremely low by historical context, but the trend forward will likely be higher rates.
As the economy is heating up, and inflation levels have been higher than expected. This has caused the FED to announce a tapering of their “quantitative easing” program.
The stock market has had several weeks of selling and was down as much as 5% from their highs. In the last week, the market has started to recover but volume has been low.
Rents have dropped as well, and there are a good number of rental vacancies on the market.
Uncertainty about work at home policies have resulted in many buyers or renters forgoing high rents or condo/townhomes to live outside of the area.
Save thousands when you sell.
Includes Free Staging and Our Complete Selling Solution
* Total commission 4% including buyer side agent commission of 2.5%, offer varies by value of home.
What Can We Expect Moving Forward?
Buyers, home demand is currently high, especially for those hard-to-find homes in good neighborhoods and locations. The outlook for the next few months will be challenging for buyers.
Something to consider is that as interest rates rise there may be a correction in the market, but we may not see that until well into the middle of or late next year.
One thing that seems certain is that home values will not be dropping any time soon, and it is likely that prices will continue to go up in the coming months.
As a buyer in this market, be clear on your goals and what you are looking for. Although you may not be able to find a “good deal” in this market, you can protect yourself from a bad one.
Sellers, contrary to what you may have read or heard, this time of year is a good time to sell your home.
Inventory is low, so your home has a better possibility of standing out.
Just a reminder, that housing in Santa Clara can vary greatly, and keep in mind that there are segments of the market that are not performing well.
It’s important to understand how your home relates to this market.
This is crucial to determining the right strategy to getting your home sold for top value.
You don’t want to be that home that buyers are passing on while the other homes are selling.
Conclusion:
As always, whether you are buying or selling, be sure to understand how your home or the property you are considering ranks in the current market. Understanding the Santa Clara housing market is important when determining the right price and a solid home investment.
If you have any questions about a home on the market or your home’s value, please feel free to reach out, I am happy to hear from you.
Contact Me Today
Have a question? Interested in setting an appointment to talk about your real estate plans? Contact me today.
-
VINICIUS BRASIL, Realtor
Keller Williams - The Brasil Group
19400 Stevens Creek Blvd #200
Cupertino, CA 95014 - 408.582.3272
- Schedule a meeting

Message Me Directly:
Santa Clara September 2021 Home Sales
| Street Address | List Price | Price | DOM | Beds Total | Bths | Sq Ft Total | Age |
| 3661 Randolph Avenue | $1,950,000 | $2,500,000 | 5 | 3 | 2|0 | 1,545 | 64 |
| 700 Cornell Drive | $1,999,000 | $2,350,000 | 7 | 4 | 2|1 | 2,884 | 60 |
| 83 Cronin Dr | $1,799,950 | $2,335,000 | 0 | 4 | 2|0 | 1,568 | 63 |
| 723 Raney Court | $1,798,000 | $2,155,000 | 13 | 6 | 3|0 | 1,903 | 66 |
| 785 Purdue Court | $1,699,900 | $2,109,999 | 7 | 4 | 3|0 | 2,198 | 60 |
| 992 Fairfield Avenue | $1,899,000 | $2,107,000 | 11 | 4 | 3|0 | 1,870 | 68 |
| 2566 Homestead Road | $2,200,000 | $2,075,000 | 12 | 4 | 3|0 | 3,179 | 0 |
| 3175 Temple Court | $1,850,000 | $2,030,000 | 7 | 4 | 2|0 | 1,760 | 58 |
| 3332 Duke Court | $1,650,000 | $1,930,000 | 7 | 3 | 2|0 | 1,442 | 59 |
| 1525 Franklin Street | $1,875,000 | $1,925,000 | 18 | 5 | 3|0 | 2,586 | 113 |
| 3071 Mauricia Avenue | $1,648,888 | $1,908,000 | 2 | 3 | 2|0 | 1,240 | 67 |
| 1183 Loyola Drive | $1,688,000 | $1,870,000 | 6 | 3 | 2|0 | 1,560 | 64 |
| 2250 Esperanca Avenue | $1,699,888 | $1,861,000 | 8 | 5 | 3|0 | 2,326 | 23 |
| 2351 Lass Drive | $1,748,888 | $1,858,000 | 9 | 5 | 3|0 | 2,326 | 24 |
| 3419 Victoria Avenue | $1,500,000 | $1,838,000 | 7 | 3 | 2|0 | 1,584 | 67 |
| 718 Pritchard Court | $1,584,000 | $1,825,000 | 8 | 3 | 2|0 | 1,318 | 66 |
| 2930 Jerald Avenue | $1,799,888 | $1,825,000 | 26 | 5 | 4|0 | 2,666 | 65 |
| 4186 Marston Lane | $1,669,000 | $1,817,500 | 7 | 4 | 2|1 | 1,754 | 19 |
| 3423 Georgetown Place | $1,388,000 | $1,780,000 | 7 | 3 | 2|0 | 1,368 | 63 |
| 2275 DENISE Drive | $1,698,888 | $1,780,000 | 12 | 3 | 2|1 | 1,745 | 57 |
| 1925 De La Pena Avenue | $1,675,000 | $1,770,000 | 0 | 3 | 2|0 | 1,426 | 74 |
| 2216 Rosita Avenue | $1,498,000 | $1,760,000 | 9 | 4 | 2|0 | 1,545 | 69 |
| 3357 Cashdan Ct | $1,488,000 | $1,750,000 | 3 | 3 | 2|0 | 1,610 | 61 |
| 637 Bucher Avenue | $1,600,000 | $1,730,000 | 9 | 3 | 2|0 | 1,166 | 67 |
| 2461 Austin Place | $1,699,889 | $1,730,000 | 17 | 4 | 2|0 | 1,628 | 64 |
| 1065 Buchanan Court | $1,599,950 | $1,715,000 | 9 | 4 | 2|0 | 1,850 | 61 |
| 3440 Bella Vista Avenue | $1,398,000 | $1,702,000 | 17 | 3 | 2|0 | 1,124 | 67 |
| 334 Pineview Drive | $1,599,000 | $1,682,000 | 12 | 4 | 3|0 | 1,810 | 67 |
| 3069 Ryan Avenue | $1,700,000 | $1,665,000 | 15 | 4 | 2|0 | 1,498 | 0 |
| 3023 Millar Avenue | $1,545,000 | $1,655,000 | 3 | 3 | 2|0 | 1,300 | 63 |
| 2265 Bohannon Drive | $1,488,000 | $1,650,000 | 8 | 3 | 2|0 | 1,435 | 69 |
| 2361 Glendenning Avenue | $1,399,999 | $1,630,000 | 7 | 3 | 2|0 | 1,364 | 66 |
| 1502 Eisenhower Drive | $1,540,000 | $1,630,000 | 18 | 4 | 3|0 | 1,898 | 61 |
| 920 Garrity Way | $1,499,950 | $1,628,000 | 17 | 3 | 3|0 | 1,590 | 17 |
| 560 Mission Street | $1,298,000 | $1,600,000 | 7 | 4 | 2|0 | 1,449 | 77 |
| 3555 Shafer Drive | $1,600,000 | $1,587,500 | 13 | 4 | 3|0 | 2,015 | 67 |
| 4596 Lakeshore Drive | $1,388,888 | $1,554,000 | 11 | 4 | 2|1 | 1,850 | 44 |
| 1652 Jackson Street | $1,399,000 | $1,550,000 | 11 | 3 | 1|1 | 1,969 | 73 |
| 1746 Jackson Street | $1,299,000 | $1,525,000 | 6 | 3 | 1|1 | 1,250 | 106 |
| 349 Pineview Drive | $1,325,000 | $1,525,000 | 6 | 3 | 2|0 | 1,116 | 67 |
| 472 Juanita Drive | $1,250,000 | $1,520,000 | 7 | 3 | 1|0 | 1,075 | 69 |
| 844 Washington Street | $1,500,000 | $1,500,000 | 0 | 5 | 2|0 | 2,096 | 93 |
| 2364 Fatjo Place | $1,298,000 | $1,475,000 | 10 | 3 | 1|0 | 1,021 | 71 |
| 4672 Wilcox Avenue | $1,298,888 | $1,460,000 | 7 | 3 | 2|1 | 1,599 | 23 |
| 2231 Rita Court | $1,200,000 | $1,450,000 | 8 | 3 | 1|0 | 1,075 | 69 |
| 2281 Cabrillo Avenue | $1,299,999 | $1,425,000 | 8 | 3 | 2|0 | 1,181 | 67 |
| 2284 Benton Street | $1,295,000 | $1,400,000 | 11 | 3 | 1|0 | 1,025 | 70 |
| 658 Robin Drive | $1,399,000 | $1,399,000 | 13 | 3 | 2|0 | 1,522 | 70 |
| 2146 Esperanca Ave | $1,395,888 | $1,370,000 | 80 | 4 | 2|1 | 1,705 | 21 |
| 631 Flannery Street | $1,299,000 | $1,360,000 | 8 | 4 | 2|0 | 1,127 | 68 |
| 2602 Cabrillo Avenue | $1,329,000 | $1,330,000 | 8 | 3 | 2|0 | 1,095 | 62 |
| 4672 Burke Drive | $1,198,000 | $1,300,000 | 6 | 4 | 2|0 | 1,167 | 61 |
| 3170 El Sobrante Street | $1,250,000 | $1,250,000 | 2 | 3 | 1|0 | 1,052 | 72 |
| 1479 Blackfield Drive | $1,299,000 | $1,240,000 | 43 | 3 | 1|0 | 1,246 | 69 |
| 3351 Snively Avenue | $1,245,000 | $1,230,000 | 43 | 3 | 2|0 | 1,166 | 67 |
| 1742 Laine Avenue | $1,149,888 | $1,200,000 | 0 | 3 | 1|0 | 1,086 | 69 |
| 2129 Bohannon Drive | $1,375,000 | $1,200,000 | 8 | 3 | 1|0 | 1,075 | 0 |
| 1821 Los Padres Boulevard | $1,198,000 | $1,198,000 | 15 | 3 | 1|0 | 1,021 | 71 |
| 1750 Chestnut Street | $1,150,000 | $1,125,000 | 12 | 3 | 2|0 | 1,535 | 41 |
| 2602 Painted Rock Drive | $999,950 | $1,100,000 | 16 | 3 | 1|0 | 897 | 67 |
| 2065 Hogan Drive | $1,087,888 | $1,100,000 | 14 | 3 | 2|0 | 1,095 | 61 |
Santa Clara Housing Market Archive
September 2021 home sales CLICK HERE.
July 2021 home sales CLICK HERE.
May 2021 home sales CLICK HERE.
April 2021 home sales CLICK HERE.
March 2021 home sales CLICK HERE.
February 2021 home sales CLICK HERE.
January 2021 home sales CLICK HERE.
November 2020 home sales CLICK HERE.
October 2020 home sales CLICK HERE.
September 2020 home sales CLICK HERE.
August 2020 home sales CLICK HERE.
July 2020 home sales CLICK HERE.
June 2020 home sales CLICK HERE.
May 2020 home sales CLICK HERE.
April 2020 home sales CLICK HERE.
March 2020 home sales CLICK HERE.
January 2020 home sales CLICK HERE.
