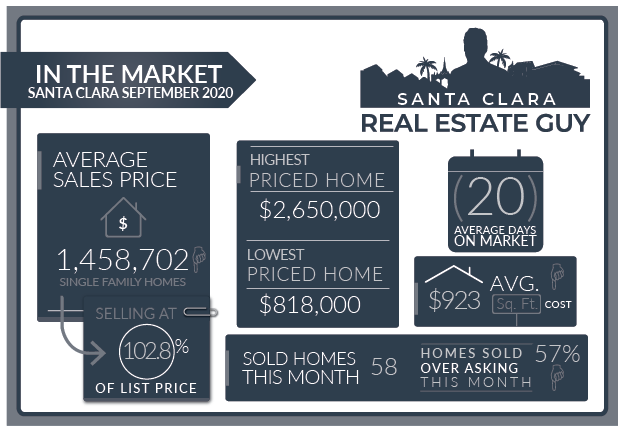
The Santa Clara housing market in September experienced 58 single-family homes that closed escrow, which is the same number that sold in August.
During September there were 47 homes that accepted contracts an decrease from the prior month’s 68 homes. During the month there were 62 new active listings that came on the market.
The average price of a home sold in September was $1.46M which is about $70K lower than last month’s figure of $1.53M. The Median price home sold was $1.4M, which is about $80K lower than August’s median price.
The average cost per square foot decreased from $962 per Sq. Ft. to $923. Of the 58 homes sold in September, 33 sold over asking.
On average homes that sold, sold 2.78% over asking compared to 4.17% over asking in the previous month.
We started the month of September with 51 active single-family home listings and finished with at 46 in all of Santa Clara.
The Santa Clara housing market continues to be very active. Is it a hot market? Not like many we have experienced in recent years, but there are lots of buyers actively looking and making offers.
September in many respects was very similar to August. We saw inventory yo-yo up and down between 60-40 homes. Whenever inventory reached 60 the buying activity would drop it down to 40 and suddenly there would be an influx of new listings on the market..
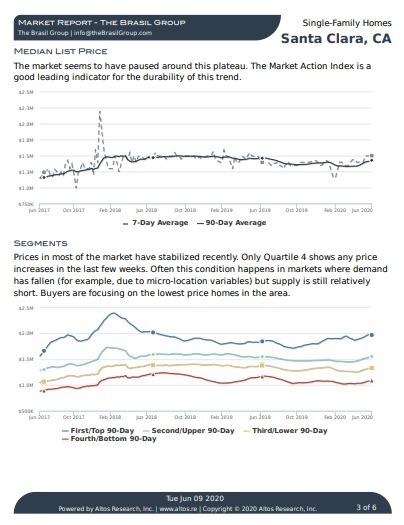
Although the numbers above may be indicating a cooling market, that isn’t the case. Certainly buyers are proceeding cautiously. If you are studying the Altos Market Action Index (MAI) you will see its trending upwards.
Also we are noticing larger higher priced homes are selling quite well in this market. Buyers seem to be preferring more space.
Altos Research Market Data For Santa Clara
Inventory is the big concern moving forward as we are in the Fall market. The typical cycle is that inventory will wane this time of year and buying opportunities for buyers will become fewer.
Also we will notice the quality of homes this time of year start to drop from the quality we experience in the Spring or Summer markets. This lower inventory generally holds prices firm and may even lead to some appreciation if the buying activity resumes healthy.
Santa Clara Market Reports
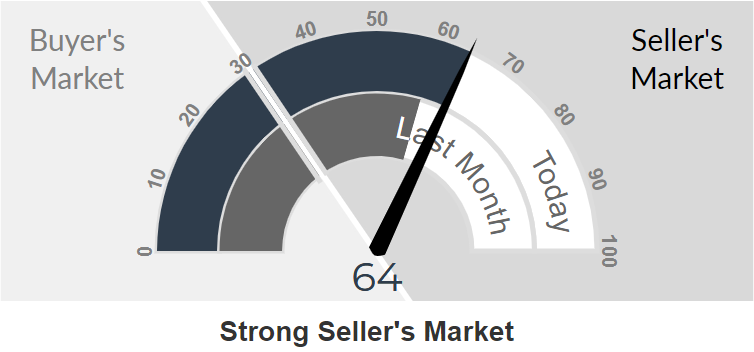
The Altos Research Market Action Index for single-family homes in Santa Clara has increased to 64 from 61 where it was last month. For more detailed reports on Santa Clara and Santa Clara Zip codes, you can access the reports here.
Santa Clara Report
95051 Report
95050 Report
95054 Report
The looming election may be something that is holding some buyers and sellers back. After the election expect that more buyers will enter the market and that could raise prices in a time of year were they are fewer homes.
Also some sellers may have less trepidation about selling during the holidays this year since they may not be traveling or entertaining. We will have to just wait and see how things play out.
Buyers, you are likely focusing on good properties as you should be and noticing that offer situations are competitive. The opportunities are likely to start drying up in the coming months, so you may want to accelerate your home purchase before prices go up or before the end of the year.
Sellers, September wasn’t much of a jump from August but things are looking good. Inventory has been hovering around the 40s lately and that is a good thing for sellers. Also, the Market Action Index (MAI) is trending upward signaling a stronger seller’s market.
As always be sure to understand what you are buying or selling. Knowing how your home or the home you are considering buying fits in the current market is important to determine the right price.
If you have any questions about a home on the market or your home’s value, please feel free to reach out I am happy to hear from you.
Santa Clara Home Sales August 2020
Santa Clara September 2020 Home Sales
| Street Address | List Price | Price | DOM | Beds Total | Baths | Sq Ft Total | Age |
| 2854 Ponderosa Way | $2,398,880 | $2,650,000 | 7 | 6 | 3|1 | 3,426 | 59 |
| 177 Claremont Avenue | $1,948,000 | $2,215,000 | 10 | 4 | 3|0 | 1,877 | 63 |
| 2600 Pepperwood Lane | $2,199,000 | $2,100,000 | 39 | 5 | 2|1 | 2,598 | 47 |
| 1057 Las Palmas Drive | $1,888,888 | $2,000,000 | 5 | 4 | 3|0 | 1,903 | 65 |
| 2846 Sycamore Way | $1,798,880 | $1,980,000 | 2 | 4 | 2|1 | 2,290 | 59 |
| 2881 Pruneridge Avenue | $1,680,900 | $1,812,250 | 7 | 4 | 2|1 | 1,809 | 60 |
| 4209 Marston Lane | $1,779,000 | $1,800,000 | 9 | 4 | 3|1 | 2,083 | 17 |
| 4428 Watson Circle | $1,748,800 | $1,748,800 | 41 | 3 | 2|1 | 2,036 | 16 |
| 2096 Dianne Drive | $1,599,000 | $1,745,000 | 7 | 3 | 3|0 | 1,587 | 59 |
| 4634 Cheeney Street | $1,699,000 | $1,730,000 | 7 | 5 | 3|0 | 2,326 | 23 |
| 3361 Tracy Drive | $1,749,888 | $1,725,000 | 20 | 3 | 2|0 | 1,265 | 63 |
| 2325 Quinn Avenue | $1,598,000 | $1,715,000 | 8 | 5 | 2|1 | 2,149 | 48 |
| 1901 Nobili Avenue | $1,598,888 | $1,668,000 | 7 | 4 | 3|0 | 1,963 | 66 |
| 3389 Saint Marys Place | $1,479,950 | $1,660,000 | 5 | 3 | 2|0 | 1,374 | 61 |
| 483 Juanita Drive | $1,649,000 | $1,650,000 | 41 | 5 | 3|0 | 2,389 | 68 |
| 2492 Gallup Drive | $1,468,000 | $1,625,000 | 7 | 4 | 2|0 | 1,614 | 55 |
| 1975 Murguia Avenue | $1,548,000 | $1,548,000 | 56 | 4 | 3|0 | 2,259 | 73 |
| 640 Wilson Court | $1,575,000 | $1,535,000 | 74 | 4 | 3|0 | 1,740 | 65 |
| 937 Sanchez Place | $1,499,999 | $1,525,000 | 29 | 4 | 3|0 | 2,402 | 0 |
| 171 Kerry Drive | $1,475,000 | $1,515,000 | 3 | 3 | 2|0 | 1,234 | 65 |
| 2201 Francis Avenue | $1,548,000 | $1,515,000 | 91 | 5 | 3|0 | 2,042 | 62 |
| 375 Alviso Street | $1,350,000 | $1,500,000 | 12 | 3 | 2|0 | 2,035 | 82 |
| 1755 Briarwood Drive | $1,525,000 | $1,500,000 | 12 | 3 | 2|0 | 1,520 | 66 |
| 435 Cypress Avenue | $1,350,000 | $1,475,000 | 8 | 3 | 2|0 | 1,329 | 67 |
| 3266 San Juan Avenue | $1,448,000 | $1,450,000 | 23 | 4 | 2|0 | 1,419 | 62 |
| 640 Clara Vista Avenue | $1,398,880 | $1,430,000 | 3 | 3 | 2|0 | 1,391 | 63 |
| 1447 Las Palmas Drive | $1,298,000 | $1,430,000 | 12 | 3 | 2|0 | 1,354 | 68 |
| 1670 Hood Court | $1,349,950 | $1,420,000 | 9 | 4 | 2|0 | 1,330 | 62 |
| 495 Wildwood Way | $1,349,000 | $1,405,000 | 6 | 4 | 2|0 | 1,666 | 52 |
| 2338 Vargas Place | $1,399,000 | $1,399,000 | 7 | 3 | 2|0 | 1,213 | 66 |
| 1216 Buchanan Drive | $1,298,000 | $1,380,372 | 7 | 3 | 2|0 | 1,735 | 60 |
| 3027 San Juan Avenue | $1,348,000 | $1,341,000 | 25 | 3 | 2|0 | 1,095 | 62 |
| 2200 Brown Avenue | $1,300,000 | $1,330,000 | 37 | 8 | 4|0 | 2,383 | 62 |
| 2553 Elliot Street | $1,299,000 | $1,326,300 | 7 | 3 | 2|0 | 1,194 | 58 |
| 159 Brookside Avenue | $1,399,000 | $1,325,000 | 16 | 4 | 3|0 | 1,302 | 79 |
| 578 Saratoga Avenue | $1,399,000 | $1,325,000 | 72 | 4 | 2|0 | 1,986 | 73 |
| 3454 Bella Vista Avenue | $1,348,888 | $1,320,000 | 11 | 3 | 2|0 | 1,574 | 66 |
| 965 Las Palmas Drive | $1,250,000 | $1,300,000 | 0 | 3 | 2|0 | 1,166 | 65 |
| 2218 Francis Avenue | $1,330,000 | $1,300,000 | 11 | 3 | 2|0 | 1,078 | 65 |
| 2355 Bohannon Drive | $1,330,000 | $1,300,000 | 28 | 3 | 1|1 | 1,563 | 67 |
| 1404 Maryann Drive | $1,198,000 | $1,275,000 | 4 | 3 | 2|0 | 1,352 | 61 |
| 593 Chapman Court | $1,100,000 | $1,260,000 | 6 | 3 | 3|0 | 2,029 | 95 |
| 2076 Calabazas Boulevard | $1,299,950 | $1,250,000 | 13 | 3 | 3|0 | 1,935 | 29 |
| 3735 Eastwood Circle | $1,299,888 | $1,250,000 | 36 | 4 | 2|0 | 1,666 | 51 |
| 2253 Lenox Place | $1,289,000 | $1,249,000 | 75 | 4 | 2|1 | 1,599 | 22 |
| 457 Saratoga Avenue | $1,190,000 | $1,230,000 | 13 | 3 | 2|0 | 1,146 | 68 |
| 2537 Rose Way | $1,100,000 | $1,220,000 | 3 | 3 | 2|0 | 1,166 | 65 |
| 2716 Donovan Avenue | $1,199,888 | $1,220,000 | 8 | 4 | 2|0 | 1,330 | 64 |
| 716 Kiely Boulevard | $1,224,800 | $1,210,000 | 33 | 3 | 2|0 | 1,145 | 64 |
| 355 Pineview Drive | $1,100,000 | $1,205,000 | 6 | 3 | 2|0 | 1,080 | 66 |
| 977 Baird Avenue | $1,199,000 | $1,199,000 | 35 | 4 | 2|0 | 1,692 | 58 |
| 3058 Barkley Avenue | $1,198,000 | $1,190,000 | 3 | 3 | 2|0 | 1,170 | 63 |
| 2805 Ruth Court | $1,249,000 | $1,175,000 | 12 | 3 | 2|0 | 1,254 | 65 |
| 1748 Laine Avenue | $1,099,950 | $1,100,000 | 19 | 3 | 1|0 | 1,341 | 68 |
| 3039 Agate Drive | $1,098,000 | $1,080,000 | 5 | 3 | 2|0 | 1,137 | 65 |
| 4676 Armour Drive | $1,060,000 | $1,020,000 | 8 | 4 | 2|0 | 1,095 | 60 |
| 1772 Main Street | $949,950 | $935,000 | 96 | 3 | 1|0 | 1,022 | 120 |
| 1765 Market Street | $718,000 | $818,000 | 6 | 3 | 1|0 | 1,324 | 115 |
Contact Me Today
Have a question? Interested in setting an appointment to talk about your real estate plans? Contact me today.
-
VINICIUS BRASIL, Realtor
Keller Williams - The Brasil Group
19400 Stevens Creek Blvd #200
Cupertino, CA 95014 - 408.582.3272
- Schedule a meeting

Santa Clara Housing Market Archive
August 2020 home sales CLICK HERE.
July 2020 home sales CLICK HERE.
June 2020 home sales CLICK HERE.
May 2020 home sales CLICK HERE.
April 2020 home sales CLICK HERE.
March 2020 home sales CLICK HERE.
January 2020 home sales CLICK HERE.
December 2019 home sales CLICK HERE.
November 2019 home sales CLICK HERE.
October 2019 home sales CLICK HERE.
September 2019 home sales CLICK HERE.
August 2019 home sales CLICK HERE.
July 2019 home sales CLICK HERE.
June 2019 home sales CLICK HERE.
May 2019 home sales CLICK HERE.
April 2019 home sales CLICK HERE.
March 2019 home sales CLICK HERE.
February 2019 home sales CLICK HERE.
January 2019 home sales CLICK HERE.
December 2018 home sales CLICK HERE.
November 2018 home sales CLICK HERE.
October 2018 home sales CLICK HERE.
September 2018 home sales CLICK HERE.
August 2018 home sales CLICK HERE.
July 2018 home sales CLICK HERE.
June 2018 home sales CLICK HERE.
May 2018 home sales CLICK HERE.
