October Santa Clara Home Sales Recap
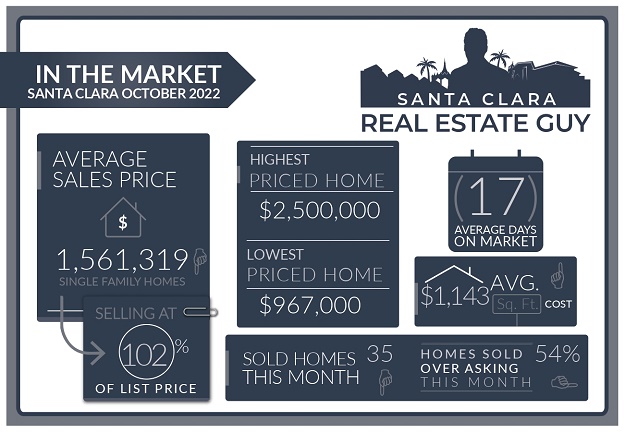
The Santa Clara housing market in October experienced 35 single-family homes that closed escrow, which is 17 less than closed escrow in the previous month of September. For some more perspective, last year there were 61 homes sold in October.
The average price of a home sold in October was $1.56M which is about $176K lower than the previous month’s figure of $1.74M. The median price home sold was $1.43M, about $220K lower than the median price in September.
The average cost per square foot saw a increase from $1079 per Sq. Ft. to $1143 per Sq. Ft. Of all the 35 homes sold in October, 19 homes sold over the list price.
On average homes that sold did so at 1.75% over asking compared to 1.06% over asking in the previous month.
We started the month of October with 39 active single-family home listings and finished with 43 active single-family homes for sale in all of Santa Clara.
For a list of sold homes in October click here or scroll down to the bottom of the page.
Market Continues to Slow
Number of home sales dropped significantly last month from the previous month.
One of the things we didn’t talk about above are how many homes are sitting on the market. There are roughly 20 homes that have been on the market for over 2 weeks, and 15 of those have been listed for at least a month.
Around 25% of homes that are listed have had a price reduction. These are homes that were priced incorrectly when they were listed and not a factor of the market slumping or experiencing a drop in values.
For the most part values are holding up quite well since the June correction.
Buyers in our current market are not in a hurry and looking for good opportunities.
Good opportunities means good homes or good deals. If a home doesn’t satisfy these criteria for a buyer its likely to sit on the market until the price reflect their value.
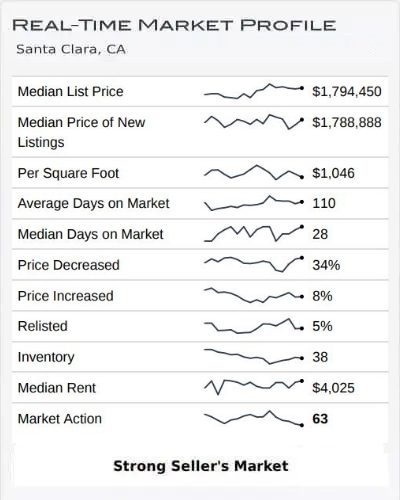
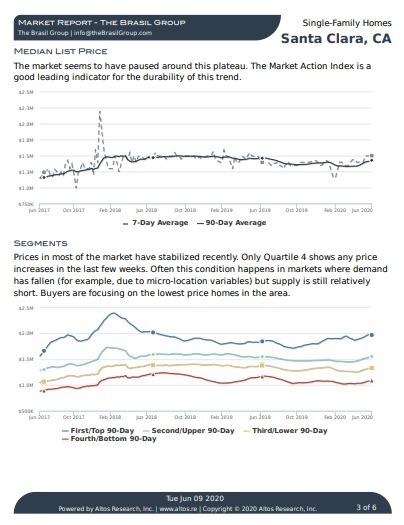
Altos Research Market Data For Santa Clara
Home Inventory is Increasing
We started November with around 43 homes on the market as of today and that number has been fluctuating around 45 homes. This includes homes that are active and homes that are coming soon.
More than half of those homes have been on the market for two weeks and a third for at least a month or more,
There are about 23 homes that are currently in pending status.
Inventory of homes for sale isn’t climbing dramatically, but you have to keep it in perspective.
This time of year it is expected that the number of home sales drop, and the corresponding number of homes on the market usually drops too.
That isn’t the situation in our current market where the number of homes for sale has been steadily increasing.
Santa Clara Market Reports
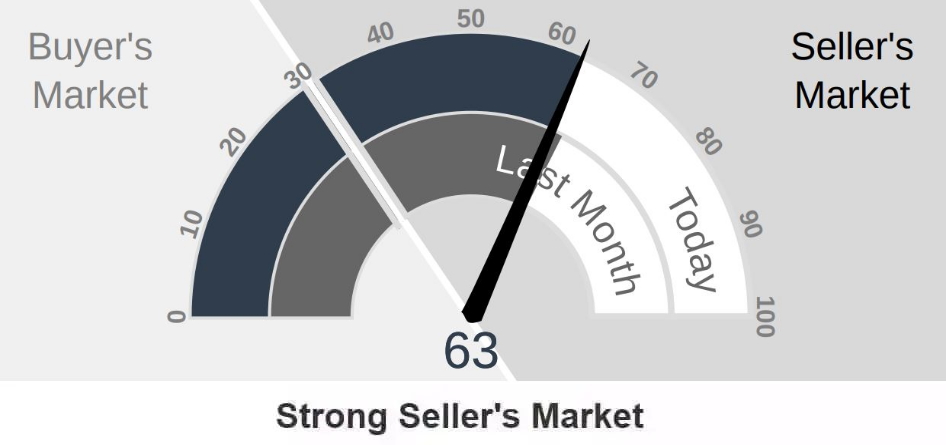
The Altos Research Market Action Index for single-family homes in Santa Clara has decreased to 63 from 67 where it was last month. For more detailed reports on Santa Clara and Santa Clara Zip codes, you can access the reports here.
Santa Clara Report
95051 Report
95050 Report
95054 Report
Multiple Offers on Some Properties
As a mentioned above, home buyers are looking for good homes or deals.
When the right home or deal comes up buyers seem to be flocking to these homes and making offers.
Our open houses continue to experience a good flow of buyer traffic. Also, the disclosure requests for homes have indicated strong interest and we are receiving multiple offers on many of our listings.
One thing to keep in mind is that our listings are priced well and presented well.
Selling your home in the current market requires accurate pricing that reflects your home’s value, aggressive marketing which includes staging and making sure the home stands out from the competition.
Many of the homes I see that are languishing on the market are overpriced or have considerable drawbacks such as location or condition.
Homes that are priced attractively and marketed well are getting strong interest and multiple offers.
If you are considering selling you may want to take a look at my video on Selling a Home in a Shifting Real Estate Market.
Other Factors in the Market:
In their latest meeting the FED increased rates another .75 points.
Mortgage rates were relatively unaffected as that increase had already been priced in to the market.
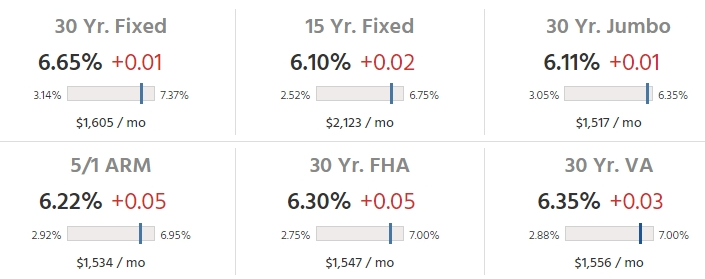
30 years fixed rates have been hovering above 7% since mid October, but just recently dropped below 7%.
Below is a table of rates on a national level. Some of our local lenders are able to lock in rates for Jumbo loans with 5 or 7 years fixed in the mid 5% range. This depends on credit scores and other factors.
Markets Year to Date
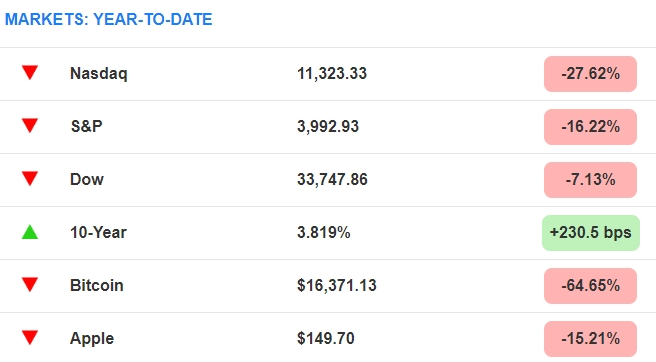
The stock market indices have been treading around lows for the year without any significant movement last month. Certain tech stocks have been hit hard recently after lower guidance and expected lower sales.
The last few sessions have seen a strong rally in the Nasdaq that was sparked by inflation data which has been encouraging.
Home buyers in our local market rely on tech stocks for their down payment and for their loan qualifications. The impact on stock values affects home buyer affordability and purchasing power.
Recent headlines that are impacting local tech jobs include Meta, the parent company of Facebook announcing a cut to 11,000 of its workforce. Not all those jobs will be in the bay area.
Twitter, which was recently acquired by Elon Musk has also made substantial cuts to its workforce. Also Amazon has announce cuts to its workforce as well.
These are the large-scale cuts. Other firms like Oracle, Lyft, Opendoor, and Salesforce have also announced job cuts.
Save thousands when you sell.
Includes Free Staging and Our Complete Selling Solution
* Total commission 4% including buyer side agent commission of 2.5%, offer varies by value of home.
What Can We Expect Moving Forward?
Buyers, is it a great time to buy?
Well, it depends. If your job is secure, and you are not worried about the market softening a bit further now is a very good time.
If you are actively looking right now you are still noticing multiple offer situations on some listings.
I really don’t see home values dropping significantly in the next few months. Many home sellers are likely to take their homes off the market and wait for a stronger market to return.
If Youtube Gurus have you thinking that they may crash I would instead look at the facts.
Most homeowners are sitting on lots of equity and those who may have purchased in the last few years although they may have lost some equity with the recent price drops, are benefiting from very low-interest rates.
With affordability dropping as interest rates increase and stock values decline, expect to see further softening in home values but no significant drops.
This doesn’t mean you can’t get a good deal out there.
With that said do I expect prices to go up next year? The answer is no.
In order for prices to go up we would have to have affordability increase, and in our current economic situation that is just not likely.
Instead, the likely scenario will be fewer sales and fewer properties available for purchase. With desirable properties standing out continuing to get the attention of buyers and multiple offers.
Sellers, homes are selling and buyers are looking.
Although affordability has taken a significant drop, home values have held up and are around their Spring 2021 values.
In the next few months, expect values to drop as more inventory becomes available.
Understand that at some point the FED will abandon its current plan, but no one knows when that will happen and the effects will not result in instant price increases. We are likely to have lots of inventory of homes to go through before the market tightens up and prices start to move up.
As a seller, you have to weigh the risks and advantages of this market. If you are thinking of trading up or down, this market is a great opportunity.
Those in this predicament will be able to make that transition easier with contingent offers, flexible terms, and lower prices which means lower capital gains on the sale.
There are lots of reasons why selling and buying in this market makes sense.
Instead of offering general suggestions here, I would encourage sellers who have questions and concerns about selling in this market to reach out to me.
Understanding your specific situation helps in determining how this market will affect you and your options. I offer free consultations to buyers and sellers to discuss their needs, so please reach out, I am happy to help.
Conclusion:
As always, whether you are buying or selling, understanding the current market will set you up for success. As I mentioned above some homes are doing quite well in this market.
Understand that the housing stock of Santa Clara is very diverse and can vary greatly from one neighborhood to the next.
Developing the right strategy for you, whether you are buying a home or thinking of selling your current home is important to succeeding in this market.
If you have any questions about a home on the market or your home’s value, please feel free to reach out, I am happy to meet and help you understand your options.
Contact Me Today
Have a question? Interested in setting an appointment to talk about your real estate plans? Contact me today.

Message Me Directly:
Message Me Directly:
Santa Clara October 2022 Home Sales
| Street Address | List Price | Price | DOM | Beds Total | Bths | Sq Ft Total | Age |
| 419 La Herran Drive | $2,298,888 | $2,500,000 | 11 | 4 | 2|0 | 1,350 | 64 |
| 291 Calvert Drive | $1,998,000 | $2,240,000 | 8 | 4 | 3|0 | 1,637 | 63 |
| 97 Jenkins Place | $2,490,000 | $2,225,000 | 14 | 3 | 2|1 | 1,667 | 19 |
| 418 Montclair Drive | $1,950,000 | $2,210,000 | 0 | 3 | 2|0 | 1,284 | 65 |
| 1789 Jeffery Court | $2,100,000 | $2,096,250 | 6 | 5 | 4|0 | 2,951 | 66 |
| 182 Muir Avenue | $1,999,999 | $2,020,000 | 12 | 3 | 2|0 | 1,400 | 64 |
| 3490 Butcher Drive | $1,599,880 | $1,860,000 | 3 | 3 | 2|0 | 1,488 | 48 |
| 3141 Mark Avenue | $1,835,000 | $1,845,000 | 6 | 3 | 2|0 | 1,502 | 64 |
| 3524 Elmhurst Avenue | $1,749,950 | $1,820,000 | 7 | 3 | 2|0 | 1,292 | 65 |
| 2812 Ruth Court | $1,788,000 | $1,750,000 | 6 | 4 | 2|0 | 1,872 | 67 |
| 2103 Dianne Drive | $1,788,000 | $1,750,000 | 21 | 3 | 2|0 | 1,603 | 61 |
| 545 Wildwood Way | $1,600,000 | $1,650,000 | 20 | 4 | 2|0 | 1,565 | 54 |
| 1271 Foley Avenue | $1,780,000 | $1,650,000 | 37 | 4 | 3|0 | 1,481 | 66 |
| 3258 Fowler Avenue | $1,668,888 | $1,605,000 | 38 | 3 | 2|0 | 1,431 | 68 |
| 1190 Madison Street | $1,498,000 | $1,563,900 | 10 | 3 | 2|0 | 1,280 | 81 |
| 2116 Fairway Glen Drive | $1,499,000 | $1,540,000 | 6 | 4 | 2|0 | 1,410 | 43 |
| 645 Enos Court | $1,600,000 | $1,535,000 | 7 | 3 | 2|0 | 1,254 | 67 |
| 2901 Jerald Avenue | $1,399,950 | $1,430,000 | 8 | 3 | 2|1 | 1,534 | 66 |
| 2375 Alberta Court | $1,449,000 | $1,425,000 | 8 | 3 | 2|0 | 1,314 | 61 |
| 599 Oakwood Drive | $1,280,000 | $1,410,000 | 5 | 3 | 2|0 | 1,008 | 57 |
| 2134 Benton Street | $1,372,888 | $1,410,000 | 2 | 3 | 2|0 | 1,251 | 72 |
| 2533 Elliot Street | $1,299,000 | $1,400,000 | 9 | 3 | 2|0 | 1,189 | 60 |
| 4472 Davis Street | $1,400,000 | $1,390,000 | 55 | 5 | 2|0 | 2,166 | 66 |
| 1047 Las Palmas Drive | $1,445,000 | $1,345,000 | 31 | 3 | 2|0 | 1,394 | 67 |
| 4506 Lakeshore Drive | $1,448,000 | $1,345,000 | 64 | 3 | 2|0 | 1,341 | 45 |
| 1185 Lincoln Street | $1,299,000 | $1,289,000 | 49 | 2 | 1|0 | 1,488 | 74 |
| 2967 Kearney Avenue | $1,098,000 | $1,250,000 | 1 | 3 | 2|0 | 1,095 | 64 |
| 2512 Amethyst Drive | $1,100,000 | $1,205,000 | 10 | 3 | 2|0 | 897 | 67 |
| 2466 Amethyst Drive | $1,100,000 | $1,200,000 | 0 | 3 | 1|0 | 897 | 67 |
| 2366 Kay Drive | $1,099,000 | $1,190,000 | 2 | 2 | 1|1 | 1,165 | 68 |
| 1157 Santa Clara Street | $1,099,000 | $1,150,000 | 32 | 2 | 2|0 | 1,372 | 120 |
| 3247 Fowler Avenue | $1,250,000 | $1,150,000 | 14 | 3 | 1|0 | 1,068 | 68 |
| 4052 Davis Street | $1,200,000 | $1,130,000 | 50 | 2 | 1|0 | 1,048 | 72 |
| 721 Clyde Avenue | $1,100,000 | $1,100,000 | 9 | 3 | 2|0 | 1,298 | 58 |
| 1290 Jefferson Street | $1,099,000 | $967,000 | 44 | 3 | 2|0 | 998 | 81 |
Santa Clara Housing Market Archive
October 2022 home sales CLICK HERE.
September 2022 home sales CLICK HERE.
August 2022 home sales CLICK HERE.
July 2022 home sales CLICK HERE.
June 2022 home sales CLICK HERE.
April 2022 home sales CLICK HERE.
March 2022 home sales CLICK HERE.
February 2022 home sales CLICK HERE.
December 2021 home sales CLICK HERE.
November 2021 home sales CLICK HERE.
October 2021 home sales CLICK HERE.
September 2021 home sales CLICK HERE.
July 2021 home sales CLICK HERE.
May 2021 home sales CLICK HERE.
April 2021 home sales CLICK HERE.
March 2021 home sales CLICK HERE.
February 2021 home sales CLICK HERE.
January 2021 home sales CLICK HERE.
November 2020 home sales CLICK HERE.
October 2020 home sales CLICK HERE.
September 2020 home sales CLICK HERE.
August 2020 home sales CLICK HERE.
July 2020 home sales CLICK HERE.
June 2020 home sales CLICK HERE.
May 2020 home sales CLICK HERE.
April 2020 home sales CLICK HERE.
March 2020 home sales CLICK HERE.
January 2020 home sales CLICK HERE.
