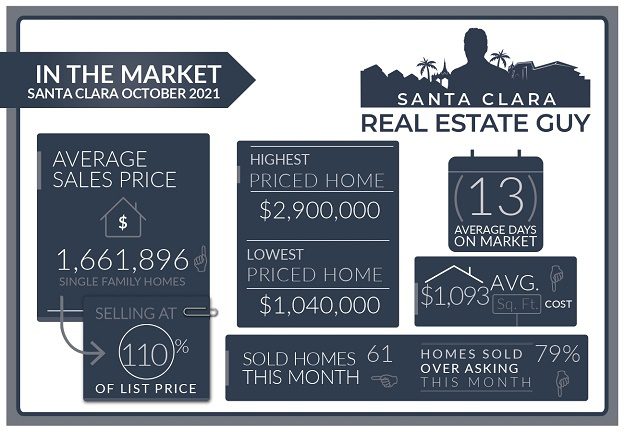
The Santa Clara housing market in October experienced 61 single-family homes that closed escrow, which is almost the same as the previous month of September.
The average price of a home sold in October was $1.66M which is about $13K higher than last month’s figure of $1.65M. The median price home sold was $1.58M, about $70K lower than the median price in September.
The average cost per square foot saw a slight decrease from $1104 per Sq. Ft. to $1093 per Sq. Ft. Of the 61 homes sold in September, 48 sold over the list price.
On average homes that sold did so at 10.17% over asking compared to 9.49% over asking in the previous month.
We started the month of October with 35 active single-family home listings and finished with 27 single family homes for sale in all of Santa Clara.
Santa Clara Real Estate Market in the Holiday Season
Home values are holding up, which is typically is the case when the holiday season begins.
As we approach Thanksgiving, Christmas, and New Year’s the inventory of homes for sale drops to the lowest levels of the year.
Currently, there are less than 20 homes on the market in all of Santa Clara, a figure that is already down from the beginning of the month.
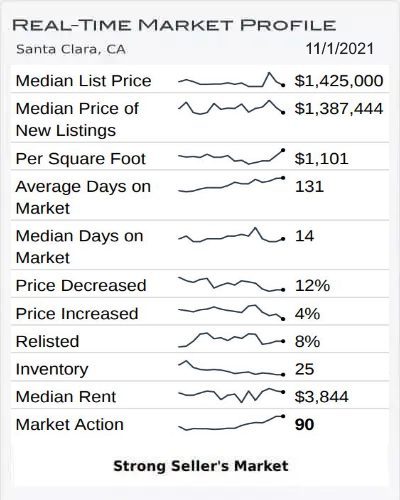
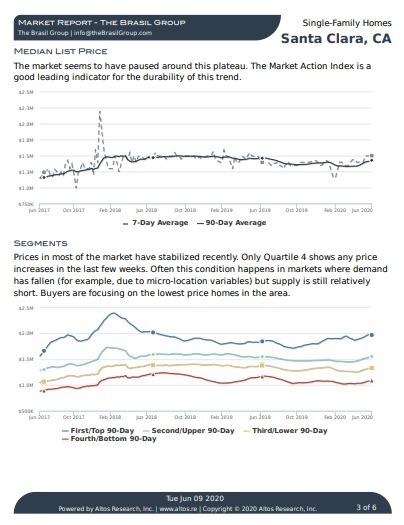
Altos Research Market Data For Santa Clara
As Inventory Drops Demand Stays Strong
Demand for homes continues to be high, especially in sought-after neighborhoods and locations. We are noticing aggressive bidding and prices rising above expectations.
Sellers are generally weary of selling their homes during the holidays.
On a national level the market does slow down quite a bit.
Our local market doesn’t follow this trend, making the holiday season a good opportunity to sell due to low competition.
For more information about selling in the winter or holiday season, check out our post Best Time To Sell a Home in Santa Clara.
In spite of there being little inventory on the market, there are a number of homes that have been listed for several weeks and even months. An indication that buyers are still searching for the right home and will not settle for just any home.
Santa Clara Market Reports
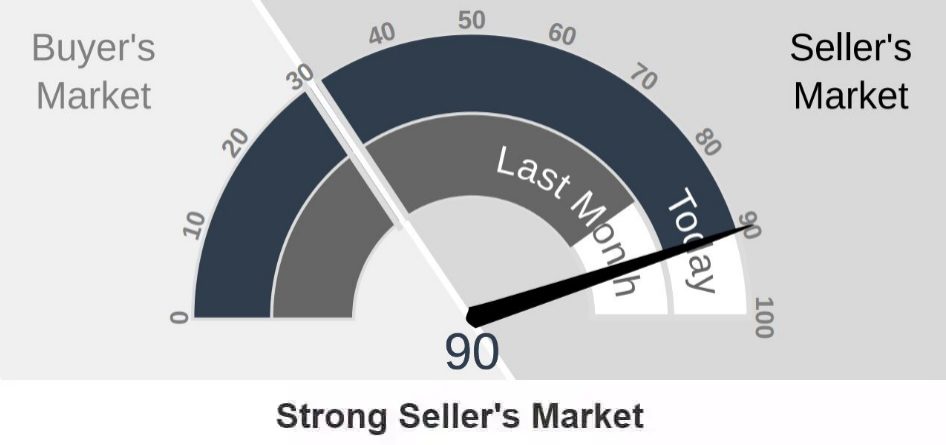
The Altos Research Market Action Index for single-family homes in Santa Clara has increased to 90 from 82 where it was last month. For more detailed reports on Santa Clara and Santa Clara Zip codes, you can access the reports here.
Santa Clara Report
95051 Report
95050 Report
95054 Report
Seasonal Trends:
The holidays generally mean a tightening of the market.
Fewer homes mean prices will stay firm and may even start to go up.
In previous years where there was a market correction in the Summer, by the time the holidays arrived pricing would stabilize, and more than likely we would see the market start to rebound at the beginning of the year.
Other Factors in the Market:
Mortgage rates continue to inch higher. There are days with substantial increases in rates followed by drops, but overall the trend is moving upward.
Rates are still extremely low and buyers are still able to lock in rates below 3%.
As prices have moved up sharply, many buyers are deciding to use 7 or 10 year fixed loans, which will remain at a fixed rate for the first few years then become variable.
Predictions for next year as the market normalizes is that housing will remain strong, but appreciation will be much lower. The condo market will start to rebound next year as well as the rental market.
Save thousands when you sell.
Includes Free Staging and Our Complete Selling Solution
* Total commission 4% including buyer side agent commission of 2.5%, offer varies by value of home.
What Can We Expect Moving Forward?
Buyers, the outlook for the next few months will be challenging. Home demand relative to supply is very high especially for those hard-to-find homes in good neighborhoods and locations.
One thing that seems certain- home values will not be dropping any time soon, and it is likely that prices will continue to go up in the coming months.
As a buyer in this market, be clear on your goals and what you are looking for. Although you may not be able to find a “good deal” in this market, you can protect yourself from a bad one.
Sellers, contrary to what you may have read or heard, this time of year is a good time to sell your home. Inventory is extremely low, so your home has a better possibility of standing out even without repairs and updates.
If you are waiting for the Spring, you may want to consider selling earlier. The main factors will be the condition of your home and how it will perform in a more crowded market.
It’s important to understand how your home relates to this market in order to determine the right strategy to get your home sold for top value.
Conclusion:
As always, whether you are buying or selling, be sure to understand how your home or the property you are considering ranks in the current market. Understanding the Santa Clara housing market is important when determining the right price and a solid home investment.
If you have any questions about a home on the market or your home’s value, please feel free to reach out, I am happy to hear from you.
Contact Me Today
Have a question? Interested in setting an appointment to talk about your real estate plans? Contact me today.
-
VINICIUS BRASIL, Realtor
Keller Williams - The Brasil Group
19400 Stevens Creek Blvd #200
Cupertino, CA 95014 - 408.582.3272
- Schedule a meeting

Message Me Directly:
Santa Clara October 2021 Home Sales
| Street Address | List Price | Price | DOM | Beds Total | Bths | Sq Ft Total | Age |
| 984 Garrity Way | $2,399,000 | $2,900,000 | 6 | 5 | 4|0 | 3,113 | 18 |
| 4425 Billings Circle | $2,288,000 | $2,500,000 | 0 | 4 | 3|1 | 2,645 | 17 |
| 3825 Thrush Way | $1,980,000 | $2,400,000 | 4 | 4 | 4|0 | 1,897 | 60 |
| 468 Los Padres Boulevard | $1,988,000 | $2,350,000 | 5 | 5 | 4|0 | 2,946 | 69 |
| 135 Brian Lane | $1,748,000 | $2,201,888 | 7 | 4 | 2|0 | 1,232 | 64 |
| 3360 Princeton Court | $1,788,888 | $2,200,000 | 5 | 4 | 2|0 | 1,760 | 60 |
| 2442 Raggio Avenue | $1,690,000 | $2,050,000 | 7 | 4 | 3|0 | 1,784 | 68 |
| 3349 Soares Court | $1,950,000 | $2,000,000 | 8 | 3 | 2|0 | 1,733 | 56 |
| 4324 Watson Circle | $1,795,000 | $1,965,000 | 8 | 3 | 2|1 | 2,036 | 17 |
| 2381 Nobili Avenue | $1,950,000 | $1,950,000 | 21 | 4 | 3|0 | 2,416 | 62 |
| 3031 Homestead Road | $1,980,000 | $1,922,760 | 12 | 4 | 3|0 | 2,198 | 3 |
| 1251 Las Palmas Drive | $1,599,000 | $1,908,000 | 7 | 3 | 2|0 | 1,393 | 67 |
| 2421 Ramke Place | $1,688,000 | $1,851,000 | 7 | 4 | 2|0 | 1,709 | 64 |
| 2722 Lyle Court | $1,638,000 | $1,838,000 | 7 | 3 | 2|0 | 1,518 | 65 |
| 508 Bancroft Street | $1,675,000 | $1,835,000 | 0 | 4 | 2|0 | 1,687 | 60 |
| 3298 Victoria Avenue | $1,498,000 | $1,820,000 | 6 | 3 | 2|0 | 1,348 | 67 |
| 262 Hayes Avenue | $1,799,999 | $1,800,000 | 33 | 3 | 2|0 | 1,240 | 67 |
| 2436 Ramke Place | $1,698,000 | $1,790,000 | 5 | 4 | 3|0 | 1,700 | 64 |
| 2831 Fargher Drive | $1,588,888 | $1,788,000 | 4 | 3 | 2|1 | 2,095 | 32 |
| 3072 Mauricia Avenue | $1,648,888 | $1,750,000 | 12 | 3 | 2|0 | 1,495 | 67 |
| 1883 Shamrock Avenue | $1,650,000 | $1,750,000 | 12 | 3 | 3|0 | 1,880 | 65 |
| 3379 Machado Avenue | $1,799,950 | $1,750,000 | 12 | 4 | 2|0 | 2,497 | 64 |
| 949 White Drive | $1,398,000 | $1,735,000 | 8 | 3 | 2|0 | 1,517 | 66 |
| 4348 Watson Circle | $1,499,800 | $1,717,500 | 6 | 3 | 3|1 | 1,657 | 17 |
| 2139 Coolidge Drive | $1,499,000 | $1,700,000 | 10 | 4 | 2|0 | 1,288 | 58 |
| 794 Ridge Road | $1,499,950 | $1,700,000 | 7 | 4 | 2|0 | 1,809 | 66 |
| 2509 Ramke Place | $1,549,889 | $1,680,000 | 3 | 3 | 2|0 | 1,170 | 66 |
| 2526 Amethyst Drive | $1,650,000 | $1,680,000 | 13 | 3 | 3|1 | 1,448 | 66 |
| 640 Hamilton Lane | $1,388,000 | $1,641,000 | 7 | 3 | 2|0 | 1,092 | 68 |
| 1163 Alice Drive | $1,625,000 | $1,625,000 | 40 | 3 | 2|1 | 2,238 | 70 |
| 1696 Betty Court | $1,495,000 | $1,580,000 | 9 | 4 | 3|0 | 2,398 | 64 |
| 1744 Pomeroy Avenue | $1,300,000 | $1,562,000 | 7 | 3 | 2|0 | 1,080 | 67 |
| 2175 San Antonio Place | $1,199,950 | $1,560,000 | 9 | 3 | 2|0 | 1,078 | 66 |
| 2430 Glendenning Avenue | $1,399,888 | $1,540,000 | 6 | 3 | 2|0 | 1,130 | 66 |
| 2346 Silveria Court | $1,498,888 | $1,540,000 | 33 | 4 | 2|0 | 1,584 | 44 |
| 2582 Patricia Drive | $1,590,000 | $1,535,000 | 2 | 5 | 3|0 | 2,285 | 66 |
| 3250 Machado Avenue | $1,250,000 | $1,530,000 | 8 | 3 | 2|0 | 1,078 | 66 |
| 2342 Kay Drive | $1,398,000 | $1,530,000 | 8 | 3 | 1|1 | 1,698 | 64 |
| 239 Kit Carson Court | $1,575,000 | $1,525,000 | 50 | 4 | 3|0 | 1,573 | 66 |
| 2185 Newhall Street | $1,500,000 | $1,515,000 | 10 | 4 | 2|0 | 1,743 | 73 |
| 3139 Fowler Avenue | $1,500,000 | $1,500,000 | 43 | 3 | 2|1 | 2,063 | 63 |
| 2238 Lenox Place | $1,299,000 | $1,482,000 | 5 | 3 | 2|1 | 1,667 | 23 |
| 2459 Borax Drive | $1,190,000 | $1,478,000 | 5 | 3 | 2|0 | 897 | 66 |
| 2085 Hogan Dr | $1,388,888 | $1,450,000 | 26 | 4 | 3|0 | 1,707 | 61 |
| 2180 Menzel Place | $1,325,000 | $1,428,000 | 1 | 3 | 2|0 | 1,181 | 67 |
| 754 Orkney Avenue | $1,299,000 | $1,420,000 | 12 | 4 | 2|0 | 1,475 | 60 |
| 2302 Roosevelt Circle | $1,499,000 | $1,400,000 | 119 | 4 | 3|0 | 1,664 | 53 |
| 1450 Fremont Street | $1,425,000 | $1,375,000 | 20 | 3 | 2|0 | 1,135 | 80 |
| 2381 Alberta Court | $998,000 | $1,360,000 | 6 | 3 | 2|0 | 984 | 60 |
| 3423 Fowler Avenue | $1,300,000 | $1,360,000 | 0 | 3 | 2|0 | 1,080 | 67 |
| 1739 Graham Lane | $999,888 | $1,350,000 | 6 | 3 | 1|0 | 1,021 | 71 |
| 1372 Mcpherson St | $1,290,000 | $1,330,000 | 8 | 3 | 2|0 | 1,166 | 67 |
| 1808 Park Vista Circle | $1,279,000 | $1,321,000 | 22 | 3 | 2|1 | 1,670 | 32 |
| 3195 Machado Avenue | $1,150,000 | $1,315,000 | 8 | 3 | 2|0 | 1,078 | 66 |
| 336 Concannon Court | $1,295,000 | $1,306,500 | 22 | 3 | 1|0 | 1,075 | 69 |
| 1996 Stanley Avenue | $1,299,000 | $1,299,000 | 4 | 3 | 2|0 | 1,324 | 0 |
| 1198 Reed Street | $1,099,000 | $1,290,000 | 8 | 3 | 2|0 | 1,218 | 45 |
| 3440 Benton Street | $1,298,800 | $1,256,000 | 55 | 3 | 2|0 | 1,166 | 67 |
| 3707 Edgefield Drive | $1,225,000 | $1,225,000 | 0 | 4 | 2|0 | 1,576 | 54 |
| 1947 Jackson Street | $999,888 | $1,175,000 | 8 | 3 | 1|0 | 1,224 | 67 |
| 1801 Chestnut St | $998,000 | $1,040,000 | 6 | 3 | 1|0 | 1,060 | 67 |
Santa Clara Housing Market Archive
October 2021 home sales CLICK HERE.
September 2021 home sales CLICK HERE.
July 2021 home sales CLICK HERE.
May 2021 home sales CLICK HERE.
April 2021 home sales CLICK HERE.
March 2021 home sales CLICK HERE.
February 2021 home sales CLICK HERE.
January 2021 home sales CLICK HERE.
November 2020 home sales CLICK HERE.
October 2020 home sales CLICK HERE.
September 2020 home sales CLICK HERE.
August 2020 home sales CLICK HERE.
July 2020 home sales CLICK HERE.
June 2020 home sales CLICK HERE.
May 2020 home sales CLICK HERE.
April 2020 home sales CLICK HERE.
March 2020 home sales CLICK HERE.
January 2020 home sales CLICK HERE.
