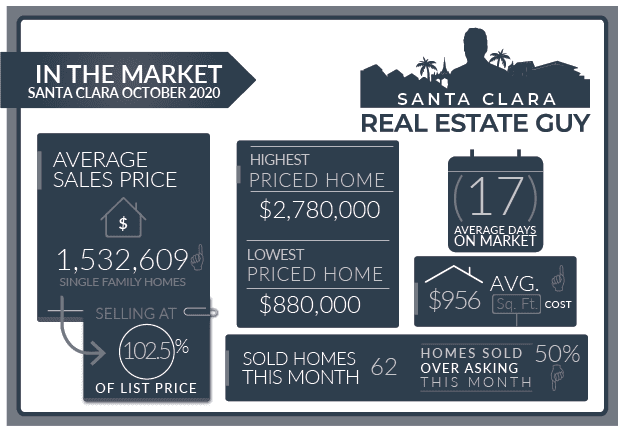
The Santa Clara housing market in October experienced 62 single-family homes that closed escrow, which is four more than sold in the previous month of September.
During October there were 51 homes that accepted contracts, an increase from the prior month’s 47 homes. During the month there were 74 new active listings that came on the market.
The average price of a home sold in October was $1.53M which is about $70K higher than last month’s figure of $1.46M. The Median price home sold was $1.46M, which is about $60K higher than September’s median price.
The average cost per square foot increased from $923 per Sq. Ft. to $956. Of the 62 homes sold in October, half sold over the list price.
On average homes that sold, sold 2.54% over asking compared to 2.78% over asking in the previous month.
We started the month of October with 51 active single-family home listings and finished with 59 in all of Santa Clara.
More sales in October than September. Median price, average price, and price per square foot all increasing. Generally this time of year sales are winding down and inventory is dropping. For the last few months we have seen sales increasing and inventory trending between 45 and 55 homes.
Although the market isn’t as hot as markets we have experienced in the past where most homes sell and prices are increasing rapidly, it certainly looks as though we me be heading that way.
Record low interest rates and a booming stock market are certainly making affordability easier for many high tech workers in the valley.
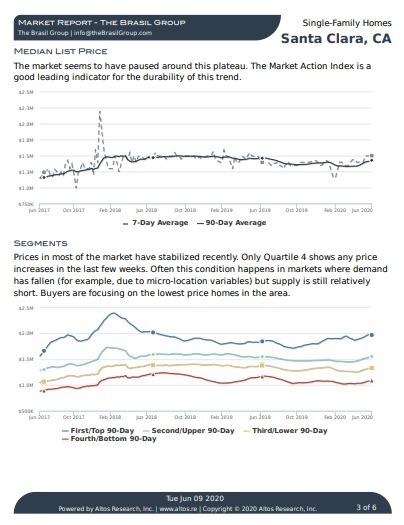
Altos Research Market Data For Santa Clara

Now that we are well into the fall market and the holidays are approaching inventory has finally started to die down. Inventory for the past two weeks has been in the low 40s, and very likely to drop further as we approach the end of the year.
As inventory drops the market will tighten further and if buyer activity remains steady expect the more and more multiple offer scenarios and increasing home values.
Santa Clara Market Reports
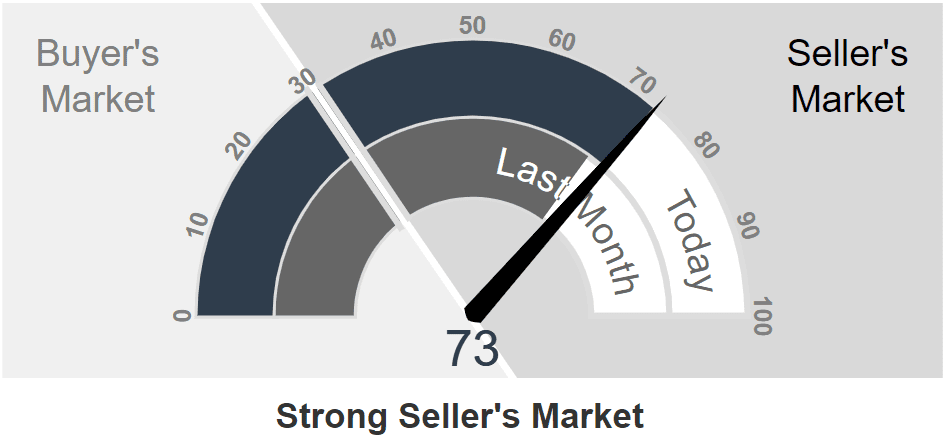
The Altos Research Market Action Index for single-family homes in Santa Clara has increased to 64 from 61 where it was last month. For more detailed reports on Santa Clara and Santa Clara Zip codes, you can access the reports here.
Santa Clara Report
95051 Report
95050 Report
95054 Report
Now the at the election is over and the democrats have regained the presidency buying activity is likely to increase further. Democrats are likely to reverse the visa and immigration restrictions imposed by the previous administration. These policies will ease the concerns of visa holders who make a large portion of the silicon valley workforce and encourage them to make long term home buying decisions.
The only uncertainty that remains is the long term implications of the pandemic and when life will finally return back to normal. As Europe enters its second wave and starts to shut down again, Santa Clara has recently announced that it is returning back to Red from Orange status. Signalling the likelihood of further shutdowns or perhaps a return back to shelter in place.
While concerns over the pandemic and its consequences are unresolved, the long term implications can be very positive for home values in the valley. Buyers will need more space as the prospect of working from home becomes more permanent. Also the FED will likely have to keep rates low and release more stimulous to help out of work Americans.
One last factor which I will not be able to go into too much detail is Prop 19. The passage of this ballot measure will certainly have a large impact on residential real estate in California. For more about that read my post on Prop 19.
Buyers, time could be running out before the market begins to get overheated and prices jump. As the opportunities start drying up in the coming weeks, you will want to accelerate your home purchase before prices go up in the new year.
Sellers, October wasn’t much of a jump from September, but November may start the shift into a much tighter market. One where price increases are likely to be more substantial. If you subscribe to our Altos Research Reports you probably have been noticing that the Market Action Index (MAI) has been trending upward in the last few months. Now and the coming months will be a great time to sell.
As always be sure to understand what you are buying or selling. Knowing how your home or the home you are considering buying fits in the current market is important to determine the right price.
If you have any questions about a home on the market or your home’s value, please feel free to reach out I am happy to hear from yo
Contact Me Today
Have a question? Interested in setting an appointment to talk about your real estate plans? Contact me today.
-
VINICIUS BRASIL, Realtor
Keller Williams - The Brasil Group
19400 Stevens Creek Blvd #200
Cupertino, CA 95014 - 408.582.3272
- Schedule a meeting

Santa Clara October 2020 Home Sales
| 2326 Quinn Avenue | $2,788,000 | $2,780,000 | 60 | 5 | 5|0 | 3,112 | 0 |
| 3365 Georgetown Place | $1,999,950 | $2,200,000 | 2 | 4 | 3|1 | 2,024 | 62 |
| 3292 Geneva Drive | $1,798,000 | $2,200,000 | 7 | 3 | 3|0 | 1,826 | 63 |
| 3819 Melody Lane | $2,149,000 | $2,149,000 | 10 | 4 | 4|0 | 1,950 | 61 |
| 3396 Mauricia Avenue | $1,980,000 | $2,100,000 | 7 | 4 | 2|0 | 1,897 | 67 |
| 2682 Estella Drive | $2,198,000 | $2,100,000 | 38 | 5 | 3|0 | 2,539 | 44 |
| 3744 Benton Street | $1,688,888 | $2,060,000 | 7 | 4 | 3|0 | 1,735 | 59 |
| 3086 Humbolt Avenue | $2,098,000 | $2,040,000 | 20 | 6 | 3|0 | 2,707 | 10 |
| 3887 Kensington Avenue | $1,688,000 | $1,950,000 | 5 | 3 | 2|0 | 1,388 | 57 |
| 947 Garrity Way | $1,899,000 | $1,940,000 | 8 | 4 | 2|1 | 2,331 | 16 |
| 1649 Monroe Street | $1,748,000 | $1,850,000 | 16 | 4 | 3|0 | 2,358 | 0 |
| 467 Bancroft Street | $1,998,888 | $1,820,000 | 20 | 5 | 3|0 | 2,229 | 60 |
| 2326 Warburton Avenue | $1,750,000 | $1,805,000 | 6 | 4 | 2|0 | 1,909 | 70 |
| 925 Peppertree Lane | $1,748,000 | $1,780,000 | 5 | 4 | 2|1 | 1,931 | 5 |
| 2880 Stevenson Street | $1,799,000 | $1,780,000 | 10 | 3 | 2|1 | 2,284 | 60 |
| 3331 Pruneridge Avenue | $1,699,000 | $1,777,000 | 6 | 5 | 3|0 | 2,679 | 59 |
| 662 Briarcliff Court | $1,650,000 | $1,750,000 | 6 | 4 | 2|0 | 1,418 | 59 |
| 3271 Catalina Avenue | $1,749,000 | $1,711,000 | 12 | 4 | 2|0 | 1,700 | 57 |
| 2315 South Drive | $1,748,000 | $1,700,000 | 38 | 6 | 3|1 | 3,030 | 55 |
| 4426 Laird Circle | $1,688,800 | $1,675,000 | 54 | 3 | 2|1 | 2,036 | 15 |
| 3465 Forest Avenue | $1,698,888 | $1,670,000 | 27 | 4 | 3|0 | 1,680 | 65 |
| 758 Los Olivos Drive | $1,449,800 | $1,625,000 | 5 | 4 | 2|0 | 1,854 | 64 |
| 2203 Dianne Drive | $1,649,000 | $1,625,000 | 7 | 3 | 2|0 | 1,794 | 58 |
| 2726 Donovan Avenue | $1,699,900 | $1,600,000 | 23 | 3 | 3|0 | 1,578 | 64 |
| 2679 Brady Court | $1,588,000 | $1,590,000 | 22 | 3 | 3|0 | 1,966 | 64 |
| 601 Woodhams Road | $1,599,900 | $1,562,500 | 5 | 5 | 3|0 | 1,962 | 59 |
| 521 Woodstock Way | $1,425,000 | $1,520,501 | 8 | 4 | 2|0 | 1,666 | 53 |
| 935 Sanchez Place | $1,550,000 | $1,515,000 | 35 | 4 | 3|0 | 2,178 | 0 |
| 2229 Duvall Court | $1,495,000 | $1,488,000 | 23 | 4 | 2|1 | 2,086 | 22 |
| 1835 Woodland Avenue | $1,475,000 | $1,475,000 | 9 | 3 | 1|1 | 1,685 | 70 |
| 2658 Warburton Avenue | $1,400,000 | $1,475,000 | 9 | 3 | 2|1 | 1,757 | 64 |
| 150 Bret Harte Court | $1,195,000 | $1,455,000 | 6 | 3 | 2|0 | 1,143 | 65 |
| 420 Hillsdale Avenue | $1,450,000 | $1,450,000 | 0 | 4 | 2|0 | 1,350 | 63 |
| 4203 Tobin Circle | $1,395,000 | $1,450,000 | 7 | 3 | 3|0 | 1,590 | 17 |
| 3494 San Marcos Way | $1,325,000 | $1,428,000 | 0 | 3 | 2|0 | 1,212 | 66 |
| 600 Mission St | $1,445,000 | $1,395,000 | 3 | 2|1 | 1,607 | 43 | |
| 1735 Bowers Avenue | $1,388,000 | $1,370,000 | 36 | 3 | 3|0 | 1,397 | 64 |
| 4572 Cheeney Street | $1,348,800 | $1,365,000 | 6 | 4 | 2|1 | 1,705 | 20 |
| 743 Salberg Avenue | $1,399,000 | $1,360,000 | 6 | 3 | 2|0 | 1,643 | 65 |
| 2590 Dixon Drive | $1,324,900 | $1,360,000 | 11 | 3 | 2|0 | 1,166 | 65 |
| 961 Las Palmas Drive | $1,298,000 | $1,338,000 | 5 | 3 | 2|0 | 1,166 | 65 |
| 1192 Foley Avenue | $1,349,000 | $1,330,000 | 14 | 3 | 2|0 | 1,645 | 64 |
| 3485 Pruneridge Avenue | $1,378,000 | $1,328,000 | 13 | 3 | 1|1 | 1,500 | 62 |
| 741 San Miguel Avenue | $1,299,999 | $1,325,000 | 46 | 3 | 2|0 | 1,459 | 66 |
| 3156 Fowler Avenue | $1,398,000 | $1,310,000 | 15 | 3 | 2|0 | 1,170 | 62 |
| 768 Caldwell Place | $1,300,000 | $1,290,000 | 60 | 3 | 2|1 | 1,543 | 32 |
| 1695 Catherine Street | $1,150,000 | $1,285,000 | 3 | 2 | 2|0 | 1,320 | 71 |
| 687 Los Olivos Drive | $1,198,888 | $1,259,000 | 14 | 3 | 2|0 | 1,085 | 66 |
| 1651 Cunningham St | $1,069,900 | $1,257,750 | 3 | 1|0 | 1,021 | 69 | |
| 3105 Machado Avenue | $1,198,000 | $1,250,000 | 6 | 3 | 2|0 | 1,078 | 65 |
| 621 Kiely Boulevard | $1,349,999 | $1,235,000 | 29 | 4 | 3|0 | 1,649 | 65 |
| 2346 Castro Place | $1,048,000 | $1,205,000 | 6 | 3 | 2|0 | 1,053 | 66 |
| 3265 Machado Avenue | $1,265,000 | $1,200,000 | 0 | 3 | 2|0 | 1,078 | 65 |
| 1870 Los Padres Boulevard | $999,950 | $1,200,000 | 7 | 3 | 2|0 | 1,218 | 66 |
| 650 Clara Vista Avenue | $1,249,000 | $1,150,000 | 58 | 3 | 2|0 | 1,085 | 63 |
| 4644 Mangrum Drive | $1,088,000 | $1,120,000 | 5 | 4 | 2|0 | 1,371 | 60 |
| 630 Park Court | $998,000 | $1,080,000 | 6 | 2 | 1|0 | 908 | 95 |
| 2108 Ventura Place | $1,098,888 | $1,063,000 | 12 | 3 | 1|0 | 994 | 65 |
| 2306 Park Avenue | $1,099,000 | $1,020,000 | 27 | 3 | 2|1 | 1,622 | 44 |
| 2279 Newhall Street | $1,025,000 | $1,000,000 | 77 | 3 | 1|0 | 1,092 | 72 |
| 4344 Cheeney Street | $949,000 | $950,000 | 10 | 2 | 1|0 | 862 | 70 |
| 1270 Washington Street | $899,950 | $880,000 | 21 | 2 | 1|0 | 1,077 | 139 |
Santa Clara Housing Market Archive
August 2020 home sales CLICK HERE.
July 2020 home sales CLICK HERE.
June 2020 home sales CLICK HERE.
May 2020 home sales CLICK HERE.
April 2020 home sales CLICK HERE.
March 2020 home sales CLICK HERE.
January 2020 home sales CLICK HERE.
December 2019 home sales CLICK HERE.
November 2019 home sales CLICK HERE.
October 2019 home sales CLICK HERE.
September 2019 home sales CLICK HERE.
August 2019 home sales CLICK HERE.
July 2019 home sales CLICK HERE.
June 2019 home sales CLICK HERE.
May 2019 home sales CLICK HERE.
April 2019 home sales CLICK HERE.
March 2019 home sales CLICK HERE.
February 2019 home sales CLICK HERE.
January 2019 home sales CLICK HERE.
December 2018 home sales CLICK HERE.
November 2018 home sales CLICK HERE.
October 2018 home sales CLICK HERE.
September 2018 home sales CLICK HERE.
August 2018 home sales CLICK HERE.
July 2018 home sales CLICK HERE.
June 2018 home sales CLICK HERE.
May 2018 home sales CLICK HERE.