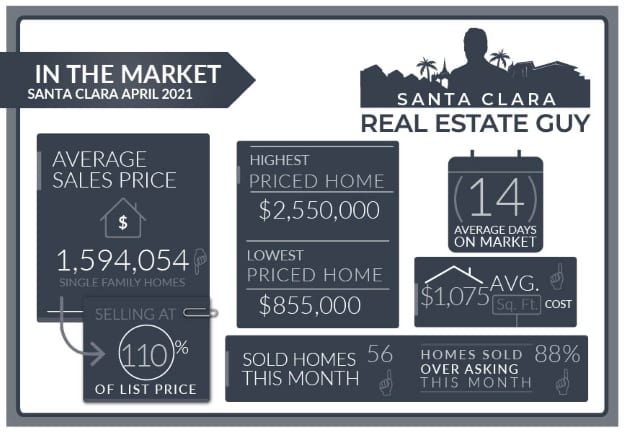
The Santa Clara housing market in April experienced 56 single-family homes that closed escrow, which is 5 more than closed escrow in the previous month of March.
The average price of a home sold in April was $1.59M which is about $10K lower than last month’s figure of $1.6M. The median price home sold was $1.62M, about $70K higher than March’s median price.
The average cost per square foot increased from $1025 per Sq. Ft. to $1075. Of the 56 homes sold in April, 49 sold over the list price.
On average homes that sold did so at 10.24% over asking compared to 9.64% over asking in the previous month.
We started the month of April with 15 active single-family home listings and finished with 37 single family homes for sale in all of Santa Clara.
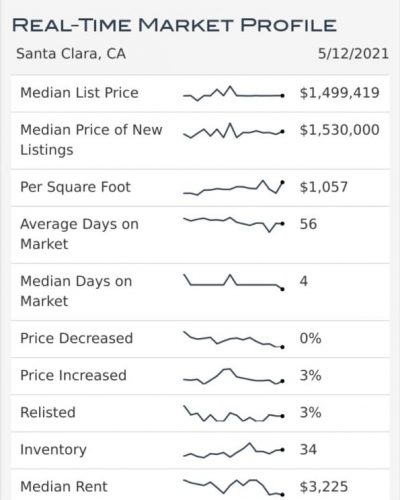
During this time of year we see the inventory of homes for sale increasing. Buyers up until now have been able to absorb new inventory and as a result inventory levels have remained pretty low. That has started to change in May.
Keep in mind that April marks the beginning of the Prop 19 period where homeowners can buy and sell, and transfer their existing property tax basis to a new home anywhere in California. This was designed to help motivate homeowners to move, and lead to more home sales.
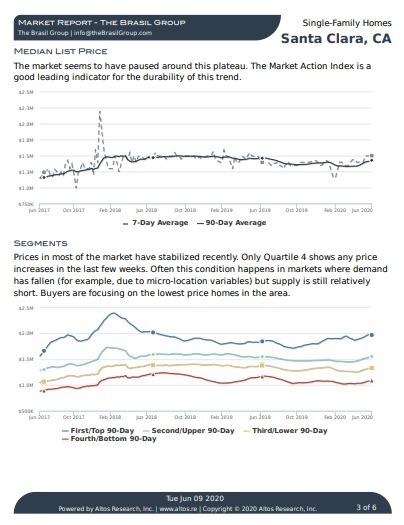
Altos Research Market Data For Santa Clara
There have been areas of the valley such as South San Jose where inventory has noticeably increased about 20% in the last month.
As we move further into the Spring inventory should increase. The longer inventory levels stay tight, the stronger home values will remain.
Santa Clara Market Reports
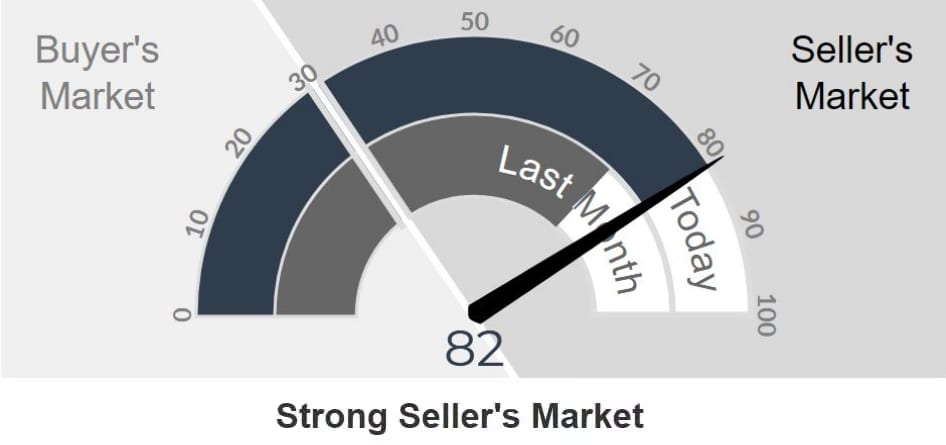
The Altos Research Market Action Index for single-family homes in Santa Clara has increased to 82 from 73 where it was last month. For more detailed reports on Santa Clara and Santa Clara Zip codes, you can access the reports here.
Santa Clara Report
95051 Report
95050 Report
95054 Report
As COVID-19 numbers drop, interest rates will trend upwards. In the last few weeks, interest rates on 30-year mortgages have been steadily increasing and are roughly up 20 basis points from the beginning of March.
Recently interest rates have settled back down but with the fear of a inflation increasing its likely that interest rates will start moving higher.
In these tight, fast appreciating markets, some home buyers will drop out of the market due to being priced out or just fatigued by the process.
As home inventory increases this will likely mean a more favorable market for buyers, and may even result in a pullback on home prices.
Inventory for townhomes and condos has also remained relatively steady in the last month. As home buyers get priced out of single-family homes some will turn to townhomes and as a result, we have seen some townhome markets in Sunnyvale and parts of Santa Clara performing much better in recent weeks.
Save thousands when you sell.
Includes Free Staging and Our Complete Selling Solution
* Total commission 4% including buyer side agent commission of 2.5%, offer varies by value of home.
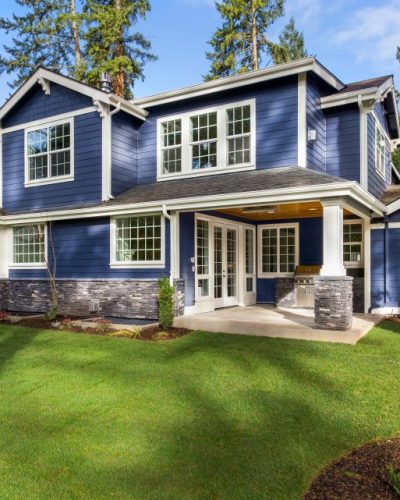
what can we expect moving forward?
Buyers, if you haven’t dropped out of the market yet due to the steep price increases, you may want to start playing it a little safe. Keep in mind that real estate in Santa Clara or any area is not general and there are always exceptions. If you a looking for a specific type of home or desirable neighborhood where these listings do not come up frequently, then it will always be a challenge to buy in any market.
Buyers who are in the market for standard 3 or 4 bedroom homes in average Santa Clara neighborhoods should be aware that this is the market that will be impacted once inventory levels start to increase.
Stay focused and keep shopping, I would expect there to be more opportunities in the next few weeks.
Sellers, I think there is a very strong chance that this market will stall in Summer. As the market typically does.
With that said, if you are planning to sell you should start the process. Understand what you need to do to get your home ready, how much time that will take, and have a plan for when you expect to have your home on the market.
As always, whether you are buying or selling, be sure to understand how your home or the property you are considering ranks in the current market. Understanding the Santa Clara housing market is important when determining the right price and solid home investment.
If you have any questions about a home on the market or your home’s value, please feel free to reach out, I am happy to hear from you.
Contact Me Today
Have a question? Interested in setting an appointment to talk about your real estate plans? Contact me today.
-
VINICIUS BRASIL, Realtor
Keller Williams - The Brasil Group
19400 Stevens Creek Blvd #200
Cupertino, CA 95014 - 408.582.3272
- Schedule a meeting

Santa Clara April 2021 Home Sales
| Street Address | List Price | Price | DOM | Beds Total | Bths | Sq Ft Total | Age |
| 2650 Birchtree Lane | $2,195,000 | $2,550,000 | 7 | 4 | 2|0 | 2,263 | 50 |
| 3649 Vireo Avenue | $2,188,000 | $2,480,000 | 6 | 4 | 2|1 | 2,701 | 28 |
| 4503 Billings Circle | $2,200,000 | $2,200,000 | 0 | 4 | 3|1 | 2,408 | 17 |
| 300 Montclair Drive | $1,680,000 | $2,100,000 | 11 | 3 | 2|0 | 1,147 | 64 |
| 2454 Alvarado Drive | $1,849,000 | $2,002,000 | 34 | 4 | 2|1 | 2,110 | 53 |
| 739 Baylor Drive | $1,798,000 | $1,980,000 | 13 | 4 | 2|0 | 1,760 | 60 |
| 1809 Lexington Street | $1,688,000 | $1,900,000 | 5 | 3 | 2|1 | 2,073 | 73 |
| 2955 Warburton Ave | $1,699,000 | $1,900,000 | 3 | 4 | 3|0 | 2,169 | 64 |
| 3639 Eastwood Circle | $1,698,000 | $1,860,000 | 7 | 4 | 2|1 | 3,024 | 53 |
| 3047 Cameron Way | $1,488,000 | $1,852,000 | 7 | 3 | 2|0 | 1,240 | 67 |
| 4157 Tobin Circle | $1,748,888 | $1,850,101 | 9 | 3 | 2|1 | 2,036 | 0 |
| 2355 Bohannon Dr | $1,599,000 | $1,850,000 | 12 | 4 | 2|0 | 1,563 | 68 |
| 1058 Las Palmas Drive | $1,588,000 | $1,850,000 | 7 | 3 | 2|0 | 1,452 | 66 |
| 2814 Toledo Avenue | $1,349,000 | $1,820,000 | 5 | 3 | 2|0 | 1,254 | 66 |
| 560 Meadow Avenue | $1,700,000 | $1,816,917 | 6 | 3 | 2|0 | 1,508 | 62 |
| 3511 Warburton Avenue | $1,749,000 | $1,780,000 | 9 | 5 | 3|0 | 2,255 | 67 |
| 2777 Forbes Avenue | $1,495,000 | $1,770,000 | 0 | 3 | 2|0 | 1,254 | 66 |
| 3468 Flora Vista Avenue | $1,498,000 | $1,755,000 | 3 | 3 | 2|0 | 1,212 | 67 |
| 3532 Gibson Avenue | $1,599,000 | $1,720,000 | 8 | 3 | 2|0 | 1,292 | 64 |
| 1142 Maryann Drive | $1,599,988 | $1,720,000 | 104 | 4 | 2|0 | 1,810 | 66 |
| 624 Los Olivos Place Drive | $1,638,000 | $1,700,000 | 6 | 4 | 3|0 | 1,520 | 65 |
| 3564 Cecil Avenue | $1,480,000 | $1,690,000 | 8 | 3 | 2|0 | 1,845 | 71 |
| 2868 Holmes Place | $1,398,000 | $1,660,000 | 7 | 4 | 2|1 | 1,939 | 16 |
| 2254 Gianera Street | $1,675,000 | $1,660,000 | 28 | 5 | 3|0 | 2,223 | 23 |
| 2349 Sawyer Court | $1,499,000 | $1,650,000 | 7 | 4 | 2|1 | 1,850 | 44 |
| 4238 Marston Lane | $1,449,888 | $1,650,000 | 5 | 3 | 2|1 | 1,671 | 19 |
| 230 Calvert Court | $1,595,000 | $1,650,000 | 35 | 3 | 2|0 | 1,129 | 65 |
| 2297 Lenox Place | $1,525,000 | $1,630,000 | 7 | 4 | 2|1 | 2,086 | 23 |
| 2355 Thompson Place | $1,499,000 | $1,600,000 | 7 | 4 | 2|0 | 1,417 | 71 |
| 39 Conner Place | $1,498,000 | $1,600,000 | 0 | 3 | 2|1 | 1,905 | 8 |
| 3865 Eastwood Circle | $1,558,888 | $1,580,000 | 37 | 5 | 2|1 | 2,010 | 56 |
| 1660 Graham Lane | $1,624,000 | $1,570,000 | 129 | 4 | 2|0 | 2,547 | 70 |
| 1798 Fremont Street | $1,298,000 | $1,565,000 | 6 | 3 | 2|0 | 1,262 | 111 |
| 2043 Cabrillo Court | $1,499,000 | $1,560,000 | 34 | 3 | 2|0 | 1,612 | 61 |
| 1282 Cabrillo Avenue | $1,350,000 | $1,450,000 | 16 | 4 | 3|0 | 1,934 | 67 |
| 4682 Burke Dr | $1,388,888 | $1,405,000 | 10 | 3 | 2|0 | 1,767 | 61 |
| 3326 Victoria Avenue | $1,199,950 | $1,400,000 | 12 | 3 | 2|0 | 1,080 | 67 |
| 946 Harrison Street | $1,299,000 | $1,380,000 | 5 | 3 | 1|0 | 1,462 | 101 |
| 3886 Eastwood Circle | $1,398,000 | $1,380,000 | 13 | 3 | 2|0 | 1,457 | 55 |
| 633 Park Court | $1,100,000 | $1,380,000 | 8 | 2 | 1|1 | 1,001 | 97 |
| 2163 Benton Street | $1,249,000 | $1,360,000 | 5 | 3 | 1|0 | 1,083 | 71 |
| 2898 Chromite Drive | $1,299,000 | $1,360,000 | 11 | 4 | 2|0 | 1,158 | 63 |
| 4647 Demaret Drive | $1,299,880 | $1,353,000 | 16 | 3 | 2|0 | 1,095 | 61 |
| 2475 Borax Drive | $1,089,000 | $1,350,000 | 7 | 3 | 2|0 | 897 | 66 |
| 2457 Amethyst Drive | $1,088,000 | $1,350,000 | 10 | 3 | 1|0 | 897 | 67 |
| 697 Los Olivos Drive | $1,200,000 | $1,310,000 | 20 | 3 | 2|0 | 1,059 | 67 |
| 2366 Warburton Avenue | $1,198,000 | $1,300,000 | 5 | 3 | 1|0 | 1,021 | 71 |
| 2245 Newhall Street | $1,170,000 | $1,250,000 | 15 | 3 | 2|0 | 1,134 | 73 |
| 3713 Hillsdale Ct | $1,240,000 | $1,240,000 | 0 | 3 | 2|0 | 1,147 | 65 |
| 2284 Forbes Avenue | $1,000,000 | $1,225,000 | 0 | 3 | 2|0 | 1,536 | 66 |
| 1831 Laine Avenue | $1,149,000 | $1,149,000 | 16 | 3 | 1|0 | 1,086 | 69 |
| 650 Park Court | $1,098,800 | $1,134,000 | 8 | 2 | 2|0 | 1,053 | 96 |
| 943 Las Palmas Drive | $1,000,000 | $1,090,000 | 0 | 3 | 2|0 | 1,166 | 66 |
| 1269 Monroe Street | $999,950 | $1,075,000 | 6 | 2 | 1|0 | 1,057 | 101 |
| 4154 Cheeney Street | $788,888 | $950,000 | 13 | 2 | 1|1 | 1,072 | 72 |
| 3465 The Alameda | $899,000 | $855,000 | 17 | 2 | 1|0 | 946 | 98 |
Santa Clara Housing Market Archive
April 2021 home sales CLICK HERE.
March 2021 home sales CLICK HERE.
February 2021 home sales CLICK HERE.
January 2021 home sales CLICK HERE.
December 2020 home sales CLICK HERE.
November 2020 home sales CLICK HERE.
October 2020 home sales CLICK HERE.
September 2020 home sales CLICK HERE.
August 2020 home sales CLICK HERE.
July 2020 home sales CLICK HERE.
June 2020 home sales CLICK HERE.
May 2020 home sales CLICK HERE.
April 2020 home sales CLICK HERE.
March 2020 home sales CLICK HERE.
January 2020 home sales CLICK HERE.
