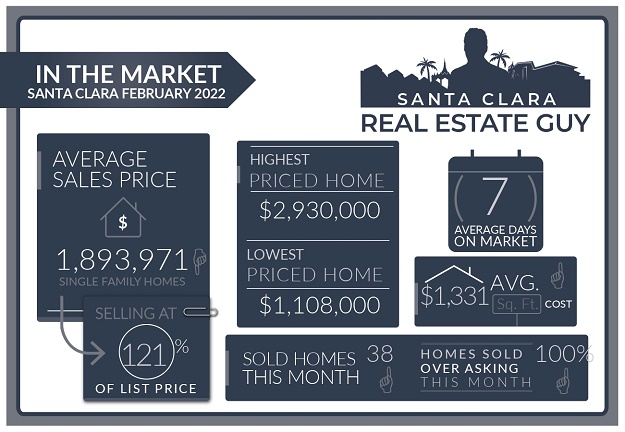
The Santa Clara housing market in February experienced 38 single-family homes that closed escrow, which is 4 more than closed escrow in the previous month of January.
The average price of a home sold in February was $1.89M which is about $159K lower than last month’s figure of $2.05M. The median price home sold was $1.9M, about $196K lower than the median price in January.
The average cost per square foot saw an increase from $1227 per Sq. Ft. to $1331 per Sq. Ft. All of the homes sold in February sold over the list price.
On average homes that sold did so at 20.96% over asking compared to 17.54% over asking in the previous month.
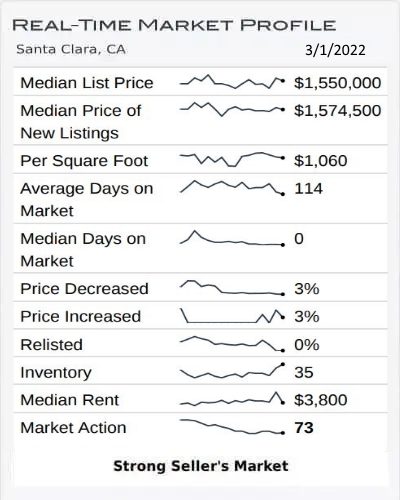
We started the month of January with 26 active single-family home listings and finished with 35 single-family homes for sale in all of Santa Clara.
Santa Clara Home Values Shooting Upwards
The market continues to see large price increases and we are continuing to see strong offers and high bidding in the first weeks of March. The number of offers have dropped a bit as more homes have come on to the market.
Low inventory continues to be a problem for home shoppers. Homes in good locations regardless of condition are getting strong interest and selling well.
Currently, there are around 25-30 homes on the market in all of Santa Clara, and that number should grow as we move further into the Spring market.
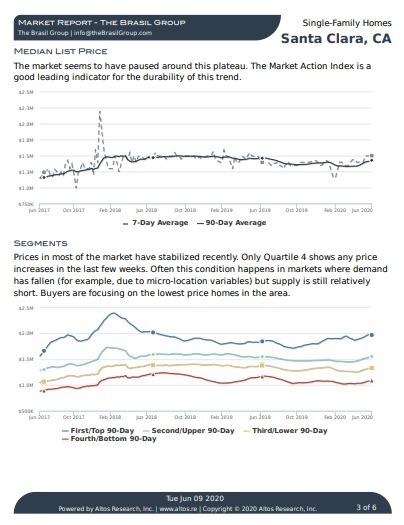
Altos Research Market Data For Santa Clara
Buyers are Anxious
Homebuyers are facing some fierce competition among other home shoppers, and the result has been aggressive bidding and rising home values.
When the market experiences price increases like what we have been seeing, it causes buyers to either get more aggressive about their home buying plans or drop out of the market.
As home values shoot up buyers may realize that they are priced out and either put their home search on hold or consider other markets.
Condo and Townhome values are also showing increases as affordability of single-family homes has become more difficult for home buyers.
The months of December and January have seen record prices across all of Santa Clara. The trend has also continued through the first weeks of February.
Santa Clara Market Reports
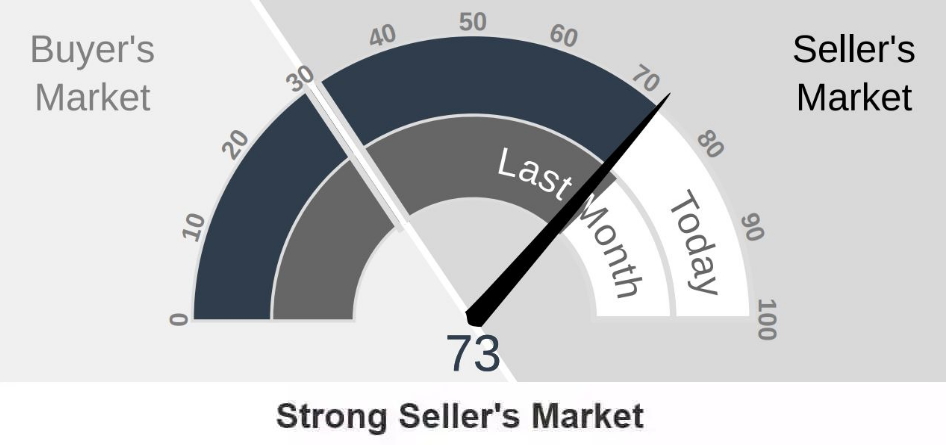
The Altos Research Market Action Index for single-family homes in Santa Clara has increased to 73 from 72 where it was last month. For more detailed reports on Santa Clara and Santa Clara Zip codes, you can access the reports here.
Santa Clara Report
95051 Report
95050 Report
95054 Report
Seasonal Trends:
This time of year we typically see low inventory and the trend is that inventory increases as we move into the Spring and the Summer markets.
Also this time of year we generally see price increases or appreciation due to the highly competitive nature of a market that has low inventory.
This makes it a great time of the year to sell a home and a very challenging time to buy. Some years are more extreme than others, and our current market is about as hot for sellers as a market can get.
Other Factors in the Market:
Mortgage rates continue to inch higher.
Combined with increasing home values and more inventory, I suspect that at some point this year the market will come to a stand still and eventually a correction.
The stock market has been selling off and is currently at lows for the year. Facebook stock has taken a huge tumble in February. Generally I don’t comment much about specific stocks, but I am sure the significant drop in Facebook shares will affect some home buyers.
The events in Ukraine continue to make headlines. The world awaits to see how Europe and the US respond and if a larger conflict will ensue.
In addition to the single family home market, the condo market has really started to rebound and condos and townhome markets have be come very competitive.
Save thousands when you sell.
Includes Free Staging and Our Complete Selling Solution
* Total commission 4% including buyer side agent commission of 2.5%, offer varies by value of home.
What Can We Expect Moving Forward?
Buyers, if you are trying to buy a home right now you can expect heavy competition and there is a good chance that even if you make a strong offer it may not be enough.
It seems that all the factors are lining up for a correction sometime they year. The question to ask is when, and by how much. There are lots of buyers still out there in the market.
I would continue to monitor inventory levels and how quickly homes are selling. Also, be sure to subscribe to Altos Reports and follow the weekly MAI.
Sellers, you are probably noticing the high price of recent home sales in your neighborhoods and the news headlines about homes selling for record prices and $100s of thousands over asking.
Yes, the market is extremely strong right now for home sellers, but a correction is looming. If your plan is to sell this year, you may want to start prepping now.
As always it’s important to understand how your home relates in this market, not all homes are getting the same level of attention.
Conclusion:
As always, whether you are buying or selling, understanding the current market and how your home relates will set you up for success. The housing stock of Santa Clara is very diverse and can vary greatly from one neighborhood to the next.
Developing the right strategy for your home will maximize your ability to sell for top value.
If you have any questions about a home on the market or your home’s value, please feel free to reach out, I am happy to hear from you.
Contact Me Today
Have a question? Interested in setting an appointment to talk about your real estate plans? Contact me today.
-
VINICIUS BRASIL, Realtor
Keller Williams - The Brasil Group
19400 Stevens Creek Blvd #200
Cupertino, CA 95014 - 408.582.3272
- Schedule a meeting

Message Me Directly:
Santa Clara February 2022 Home Sales
| Street Address | List Price | Price | DOM | Beds Total | Bths | Sq Ft Total | Age |
| 358 Dawson Drive | $1,888,000 | $2,930,000 | 7 | 3 | 2|0 | 1,508 | 64 |
| 355 Pineview Drive | $2,199,999 | $2,630,000 | 1 | 4 | 3|0 | 1,926 | 0 |
| 1660 Graham Lane | $1,999,999 | $2,600,000 | 7 | 4 | 3|1 | 2,602 | 71 |
| 3323 Geneva Drive | $1,899,900 | $2,500,000 | 7 | 3 | 2|0 | 1,383 | 65 |
| 1211 Los Padres Boulevard | $1,999,000 | $2,401,000 | 4 | 4 | 3|0 | 2,236 | 71 |
| 3533 Elmhurst Avenue | $1,999,900 | $2,400,000 | 7 | 3 | 2|0 | 1,409 | 63 |
| 2806 Ramona Court | $1,798,000 | $2,350,000 | 9 | 3 | 3|0 | 1,605 | 66 |
| 1137 Morton Ave | $2,199,999 | $2,300,000 | 10 | 4 | 2|0 | 1,837 | 66 |
| 3151 Humbolt Avenue | $1,698,000 | $2,290,000 | 7 | 3 | 2|0 | 1,665 | 71 |
| 586 Eden Court | $1,800,000 | $2,200,880 | 6 | 3 | 2|0 | 1,335 | 62 |
| 1205 Buchanan Drive | $1,599,000 | $2,150,000 | 7 | 4 | 2|0 | 1,418 | 62 |
| 393 Jefferson Street | $1,820,000 | $2,115,000 | 8 | 4 | 2|0 | 1,968 | 116 |
| 3031 Homestead Road | $1,988,000 | $2,100,000 | 7 | 4 | 3|0 | 2,198 | 3 |
| 644 Tulane Drive | $1,680,000 | $2,097,000 | 2 | 3 | 2|0 | 1,335 | 62 |
| 1169 Las Palmas Drive | $1,498,000 | $2,068,000 | 5 | 3 | 2|0 | 1,134 | 67 |
| 936 Fremont Street | $1,588,888 | $2,000,000 | 2 | 3 | 2|0 | 1,564 | 91 |
| 2037 Lovell Place | $1,498,000 | $1,999,000 | 7 | 3 | 3|0 | 1,971 | 30 |
| 1875 Harrison Street | $1,499,000 | $1,975,000 | 6 | 3 | 2|0 | 1,461 | 74 |
| 4365 Laird Circle | $1,650,000 | $1,922,000 | 6 | 3 | 3|1 | 1,657 | 17 |
| 1745 Nobili Avenue | $1,499,950 | $1,887,000 | 9 | 3 | 2|0 | 1,364 | 68 |
| 650 KIELY Boulevard | $1,848,800 | $1,870,000 | 7 | 3 | 2|0 | 1,254 | 0 |
| 2500 Monroe Street | $1,600,000 | $1,783,000 | 7 | 4 | 2|0 | 1,693 | 57 |
| 680 Hamilton Lane | $1,495,000 | $1,750,000 | 8 | 3 | 2|0 | 1,127 | 69 |
| 3707 Edgefield Drive | $1,550,000 | $1,725,000 | 9 | 4 | 2|0 | 1,576 | 55 |
| 875 Orkney Avenue | $1,390,000 | $1,690,000 | 10 | 4 | 2|0 | 1,449 | 60 |
| 3385 Cabrillo Avenue | $1,650,000 | $1,680,000 | 8 | 3 | 2|0 | 1,425 | 63 |
| 3116 Hazelwood Avenue | $1,565,000 | $1,620,000 | 1 | 3 | 2|0 | 1,134 | 64 |
| 2203 Pruneridge Avenue | $1,299,000 | $1,600,000 | 10 | 3 | 2|0 | 1,140 | 67 |
| 4673 Mangrum Drive | $1,500,000 | $1,600,000 | 6 | 3 | 2|0 | 1,095 | 62 |
| 2161 Esperanca Ave | $1,331,000 | $1,510,000 | 8 | 3 | 2|1 | 1,473 | 23 |
| 2437 Amethyst Drive | $1,099,000 | $1,400,000 | 6 | 3 | 1|0 | 897 | 68 |
| 2059 Monroe Street | $1,299,000 | $1,370,000 | 7 | 4 | 2|0 | 1,227 | 67 |
| 2819 Agate Drive | $999,950 | $1,365,000 | 8 | 3 | 1|0 | 1,144 | 68 |
| 473 Norwood Circle | $1,199,000 | $1,350,000 | 6 | 3 | 3|0 | 1,291 | 15 |
| 1241 Warburton Avenue | $1,225,000 | $1,300,000 | 8 | 3 | 1|0 | 924 | 0 |
| 2068 Monroe Street | $1,000,000 | $1,185,000 | 8 | 3 | 1|0 | 985 | 68 |
| 1387 Madison Street | $858,000 | $1,150,000 | 8 | 3 | 1|0 | 1,144 | 70 |
| 845 Main St | $899,000 | $1,108,000 | 8 | 2 | 1|0 | 784 | 102 |
Santa Clara Housing Market Archive
February 2022 home sales CLICK HERE.
December 2021 home sales CLICK HERE.
November 2021 home sales CLICK HERE.
October 2021 home sales CLICK HERE.
September 2021 home sales CLICK HERE.
July 2021 home sales CLICK HERE.
May 2021 home sales CLICK HERE.
April 2021 home sales CLICK HERE.
March 2021 home sales CLICK HERE.
February 2021 home sales CLICK HERE.
January 2021 home sales CLICK HERE.
November 2020 home sales CLICK HERE.
October 2020 home sales CLICK HERE.
September 2020 home sales CLICK HERE.
August 2020 home sales CLICK HERE.
July 2020 home sales CLICK HERE.
June 2020 home sales CLICK HERE.
May 2020 home sales CLICK HERE.
April 2020 home sales CLICK HERE.
March 2020 home sales CLICK HERE.
January 2020 home sales CLICK HERE.
