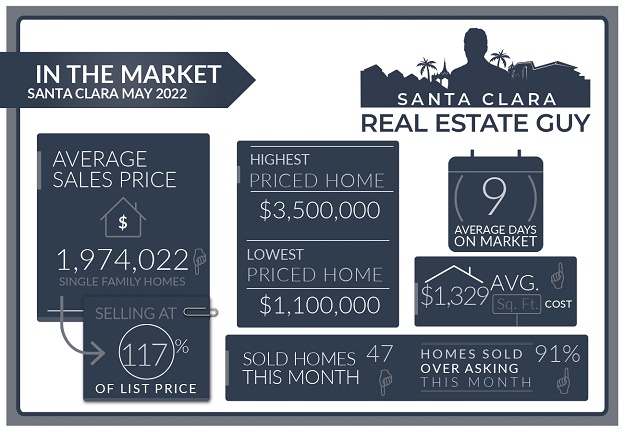
The Santa Clara housing market in May experienced 47 single-family homes that closed escrow, which is 12 less than closed escrow in the previous month of May.
The average price of a home sold in May was $1.97M which is about $69K lower than last month’s figure of $2.04M. The median price home sold was $1.95M, about $44K higher than the median price in May.
The average cost per square foot saw an increase from $1321 per Sq. Ft. to $1329 per Sq. Ft. All of the 47 homes sold in May, 43 sold over the list price.
On average homes that sold did so at 17.34% over asking compared to 19.26% over asking in the previous month.
We started the month of May with 40 active single-family home listings and finished with 45 active single-family homes for sale in all of Santa Clara.
The Market has Shifted
In last month’s market report we discussed how homes are taking longer to sell and there are more homes on the market.
This month we have what could be categorized as the biggest market shift we have seen in decades.
With interest rates reaching heights not seen since 2007 and stock market indices retracting back to September 2020 levels, we have seen a significant drop in home values.
Values have dropped from their peaks, and are likely to drop further.
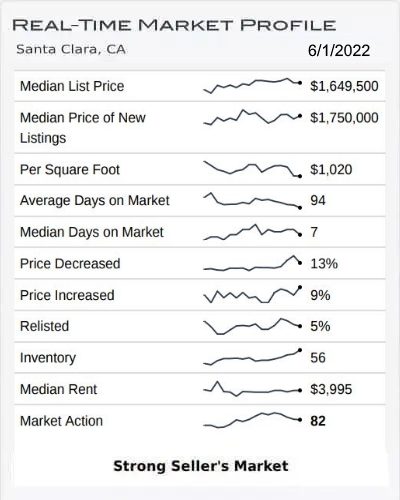
As of this article, there are around 60 single-family homes on the market in Santa Clara.
For more information about how this occurred, you can view my latest video on the market shift.
Altos Research Market Data For Santa Clara
Home Values Have Dropped
It’s difficult to pinpoint how much values have decreased from their tops. I would put it around 15-20% at the moment.
There is one case in the Bowers crest neighborhood where a 3 bedroom 2 bath home was sold for $1.92M which closed in May. A recent sale in that neighborhood will close around $1.65M.
There are currently 4 homes that are active in Bowers Crest listed between $1.4M and $1.5M and have been so for a few weeks.
As demand weakens homes are languishing on the market, increasing inventory and putting downward pressure on prices.
Santa Clara Market Reports
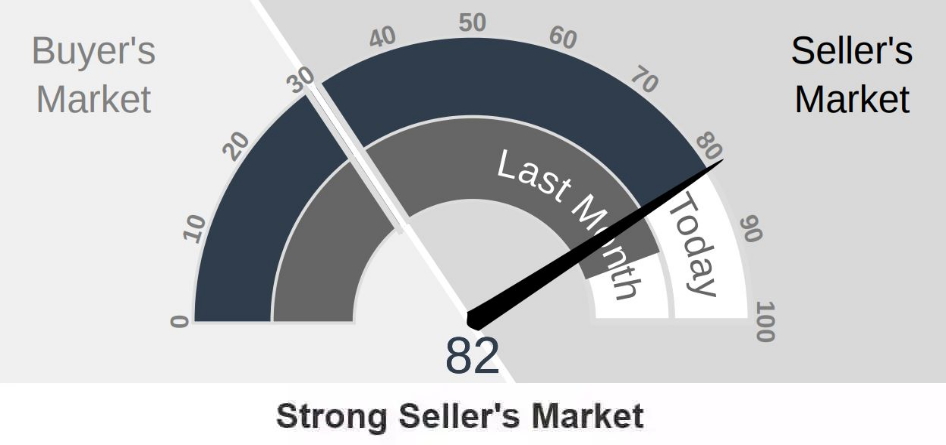
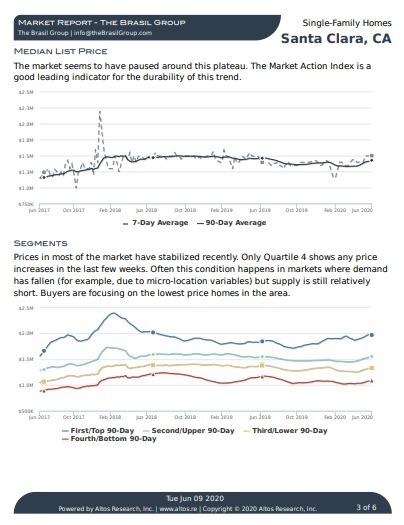
The Altos Research Market Action Index for single-family homes in Santa Clara has decreased to 82 from 86 where it was last month. For more detailed reports on Santa Clara and Santa Clara Zip codes, you can access the reports here.
Santa Clara Report
95051 Report
95050 Report
95054 Report
Seasonal Trends:
We are in the Summer market which tends to have the highest levels of inventory.
In previous months the buyers were absorbing the new inventory well and as a result, inventory stayed low.
Currently, inventory is rising steadily. With 60 single-family homes on the market its double the levels we had in early March. We can expect inventory levels of homes for sale to continue to rise as we progress into July and August.
Other Factors in the Market:
Mortgage rates made another significant jump after the FED’s recent decision to raise rates .75 points.
In our market, this tends to have a compound effect on buyers. Interest rates slow the economy which in turn leads to significant selling in the stock market.
Our high real estate values rely on cheap or low rates. As rates increase it becomes more difficult for home buyers to continue to afford already high real estate prices.
Perhaps the biggest factor and the most important is the attitude of buyers in the market. Many have paused their home search, weary that prices may fall further or concerned about the economic conditions and jobs.
Either way its a vast shift from the attitudes that were driving the market just two months ago.
Save thousands when you sell.
1.5% Listing Fee*
Includes Free Staging and Our Complete Selling Solution
* Total commission 4% including buyer side agent commission of 2.5%, offer varies by value of home.
What Can We Expect Moving Forward?
Buyers, it’s a great time to buy a home, and I rarely say that.
What I mean is the conditions are such that you can really shop. Will values go down further, it’s very likely yes. Will values eventually come back again that would be a yes.
The timing of all this is hard to say, and as a buyer timing the market can be tough. Just like the market shifted suddenly and prices dropped, there will come a time when inventory is low, interest rates drop, and multiple offers return.
So as always proceed cautiously, be picky, and make smart decisions.
Understand that rates will eventually drop. There is lots of debate about how soon this will happen, but I suspect it will happen as early as the end of the year or early next year.
Sellers, if you didn’t get your home on the market by early May, you missed what was possibly the strongest real estate market we have ever seen.
This is tough for many sellers and agents to comprehend how much the market can change and has changed in just a few weeks.
As the market corrects and adjusts to the new normal, as a seller your expectations must be in line with the market or risk losing thousands in equity.
More importantly, if you are planning to sell; strategy, pricing, and timing are more critical than ever.
I recommend you watch my video on the Shifting Real Estate Market to understand what sellers need to do in the current market to get their homes sold.
Conclusion:
As always, whether you are buying or selling, understanding the current market and how your home relates will set you up for success. The housing stock of Santa Clara is very diverse and can vary greatly from one neighborhood to the next.
Developing the right strategy for your home will maximize your ability to sell for top value.
If you have any questions about a home on the market or your home’s value, please feel free to reach out, I am happy to hear from you.
Contact Me Today
Have a question? Interested in setting an appointment to talk about your real estate plans? Contact me today.
-
VINICIUS BRASIL, Realtor
Keller Williams – The Brasil Group
19400 Stevens Creek Blvd #200
Cupertino, CA 95014 -
408.582.3272
-
e-mail
-
Schedule a meeting

Message Me Directly:
Santa Clara May 2022 Home Sales
| Street Address | List Price | Price | DOM | Beds Total | Bths | Sq Ft Total | Age |
| 2866 Mesquite Drive | $3,200,000 | $3,500,000 | 0 | 5 | 5|2 | 3,557 | 59 |
| 2344 Cabrillo Avenue | $2,398,000 | $3,006,000 | 7 | 4 | 3|0 | 2,404 | 5 |
| 1183 Inverness Avenue | $2,499,999 | $2,850,000 | 7 | 4 | 3|1 | 2,203 | 73 |
| 3746 Dunford Way | $1,998,000 | $2,813,000 | 13 | 4 | 2|0 | 1,480 | 61 |
| 638 Enos Court | $1,995,000 | $2,725,000 | 5 | 4 | 3|0 | 1,717 | 68 |
| 631 Wilson Court | $2,179,000 | $2,565,000 | 6 | 3 | 2|0 | 1,444 | 68 |
| 662 Starr Court | $2,298,000 | $2,520,000 | 7 | 3 | 3|0 | 1,643 | 67 |
| 663 Tulane Drive | $2,199,000 | $2,436,000 | 23 | 5 | 3|0 | 2,090 | 61 |
| 2152 Santa Cruz Avenue | $1,950,000 | $2,406,500 | 18 | 4 | 4|0 | 2,121 | 67 |
| 99 Gilbert Avenue | $1,898,000 | $2,350,000 | 1 | 3 | 2|0 | 1,400 | 64 |
| 2343 Rambo Court | $1,990,000 | $2,275,000 | 11 | 5 | 4|0 | 3,450 | 45 |
| 2029 Brown Court | $1,798,000 | $2,200,000 | 14 | 5 | 4|0 | 1,767 | 62 |
| 3195 Temple Court | $2,199,000 | $2,199,000 | 12 | 3 | 2|0 | 1,935 | 59 |
| 3116 Hazelwood Avenue | $1,898,000 | $2,150,000 | 6 | 3 | 2|0 | 1,134 | 64 |
| 3363 Creighton | $1,799,000 | $2,139,250 | 8 | 3 | 2|0 | 1,368 | 64 |
| 2951 Humbolt Avenue | $1,699,950 | $2,130,000 | 7 | 3 | 2|0 | 1,487 | 71 |
| 2286 Consuelo Avenue | $1,598,000 | $2,120,000 | 5 | 3 | 2|1 | 1,435 | 70 |
| 3472 Bonita Avenue | $1,680,000 | $2,120,000 | 7 | 3 | 2|0 | 1,240 | 66 |
| 2150 Brown Avenue | $1,499,000 | $2,052,000 | 9 | 3 | 2|0 | 1,226 | 64 |
| 4469 Cheeney Street | $1,688,800 | $2,000,000 | 6 | 3 | 2|0 | 2,017 | 8 |
| 3484 Kenyon Drive | $1,888,000 | $2,000,000 | 6 | 3 | 2|0 | 1,804 | 0 |
| 1727 Eberhard Street | $1,850,000 | $1,960,000 | 11 | 3 | 2|0 | 1,671 | 71 |
| 1324 Bellomy Street | $1,698,000 | $1,958,000 | 5 | 3 | 2|0 | 1,841 | 44 |
| 2717 Forbes Avenue | $1,698,000 | $1,953,800 | 8 | 3 | 2|0 | 1,254 | 67 |
| 2212 Nobili Avenue | $1,499,950 | $1,910,000 | 9 | 3 | 3|0 | 1,368 | 65 |
| 743 Hamilton Lane | $1,699,000 | $1,910,000 | 9 | 4 | 2|0 | 1,481 | 67 |
| 1834 Graham Lane | $1,799,888 | $1,900,000 | 32 | 4 | 3|0 | 2,221 | 70 |
| 2053 Kimberlin Place | $1,498,000 | $1,870,000 | 6 | 3 | 3|0 | 1,935 | 29 |
| 2316 Bohannon Drive | $1,975,000 | $1,825,000 | 26 | 3 | 2|0 | 1,995 | 70 |
| 3369 Granada Court | $1,199,888 | $1,760,000 | 8 | 3 | 2|0 | 1,166 | 68 |
| 1320 Los Padres Boulevard | $1,398,000 | $1,701,000 | 7 | 3 | 1|1 | 1,238 | 68 |
| 2170 Cabrillo Ave | $1,475,000 | $1,700,000 | 11 | 3 | 2|0 | 1,181 | 68 |
| 708 Flannery Street | $1,599,888 | $1,700,000 | 14 | 4 | 2|0 | 1,370 | 67 |
| 1654 Scott Boulevard | $1,298,000 | $1,630,000 | 6 | 3 | 2|0 | 1,021 | 71 |
| 2380 Forbes Avenue | $1,399,000 | $1,630,000 | 8 | 3 | 2|0 | 1,291 | 67 |
| 2622 Meadowbrook Drive | $1,199,888 | $1,600,000 | 8 | 3 | 1|0 | 897 | 67 |
| 2204 Monterey Avenue | $1,399,000 | $1,579,500 | 7 | 3 | 2|0 | 1,078 | 67 |
| 2424 Crystal Drive | $1,299,950 | $1,555,000 | 8 | 3 | 1|0 | 1,093 | 67 |
| 2159 Avenida De Las Flores | $1,390,000 | $1,550,000 | 7 | 3 | 2|0 | 1,341 | 46 |
| 1950 Larsen Place | $1,479,000 | $1,550,000 | 6 | 4 | 2|0 | 1,361 | 62 |
| 475 Wildwood Way | $1,250,000 | $1,500,000 | 4 | 3 | 2|0 | 1,312 | 55 |
| 1765 Ravizza Avenue | $1,350,000 | $1,350,000 | 6 | 3 | 1|0 | 1,038 | 0 |
| 2538 Crystal Drive | $1,199,000 | $1,300,000 | 3 | 3 | 1|0 | 897 | 68 |
| 1800 Nelson Drive | $1,299,950 | $1,300,000 | 28 | 4 | 2|0 | 1,095 | 62 |
| 2024 Jackson Street | $998,000 | $1,230,000 | 7 | 3 | 1|0 | 985 | 68 |
| 1911 Jackson Street | $1,049,888 | $1,200,000 | 9 | 3 | 1|0 | 985 | 68 |
| 954 Reeve Street | $999,999 | $1,100,000 | 6 | 3 | 1|0 | 972 | 102 |
Santa Clara Housing Market Archive
April 2022 home sales CLICK HERE.
March 2022 home sales CLICK HERE.
February 2022 home sales CLICK HERE.
December 2021 home sales CLICK HERE.
November 2021 home sales CLICK HERE.
October 2021 home sales CLICK HERE.
September 2021 home sales CLICK HERE.
July 2021 home sales CLICK HERE.
May 2021 home sales CLICK HERE.
April 2021 home sales CLICK HERE.
March 2021 home sales CLICK HERE.
February 2021 home sales CLICK HERE.
January 2021 home sales CLICK HERE.
November 2020 home sales CLICK HERE.
October 2020 home sales CLICK HERE.
September 2020 home sales CLICK HERE.
August 2020 home sales CLICK HERE.
July 2020 home sales CLICK HERE.
June 2020 home sales CLICK HERE.
May 2020 home sales CLICK HERE.
April 2020 home sales CLICK HERE.
March 2020 home sales CLICK HERE.
January 2020 home sales CLICK HERE.
