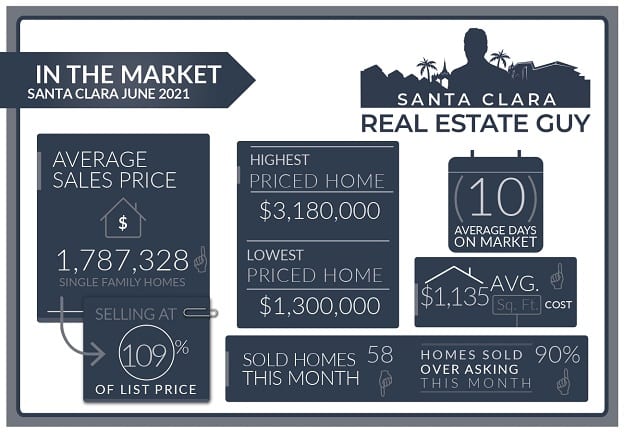
The Santa Clara housing market in June experienced 58 single-family homes that closed escrow, which is 14 less than closed escrow in the previous month of May.
The average price of a home sold in June was $1.79M which is about $172K higher than last month’s figure of $1.61M. The median price home sold was $1.70M, about $125K higher than May’s median price.
The average cost per square foot had a slight increased from $1101 per Sq. Ft. to $1135 per Sq. Of the 58 homes sold in June, 52 sold over the list price.
On average homes that sold did so at 9.98% over asking compared to 9.34% over asking in the previous month.
We started the month of June with 49 active single-family home listings and finished with 42 single family homes for sale in all of Santa Clara.
Judging from June’s numbers the market seems to be in high gear.
June’s average home sale price was considerably higher the May, and homes are selling on average 9% above their asking price.
Keep in mind that June also experienced some high home sales. There was a $3M home sold which is not typical for Santa Clara. Aside from that home there were several other homes which closed in the mid $2M range raising the average price for June.
Average price per Sq. Ft. stayed about the same price, indicating that their was some appreciation in the market. If we saw price per square foot drop it would have been an indication that only more expensive and larger homes closed in June. The reality is that home values increased in June.
We also need to keep in mind that June closings were the result of home sales in May. Also July’s closings will be the result of homes that were put in contract during June.
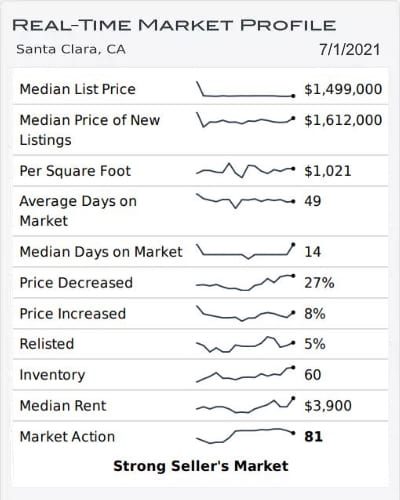
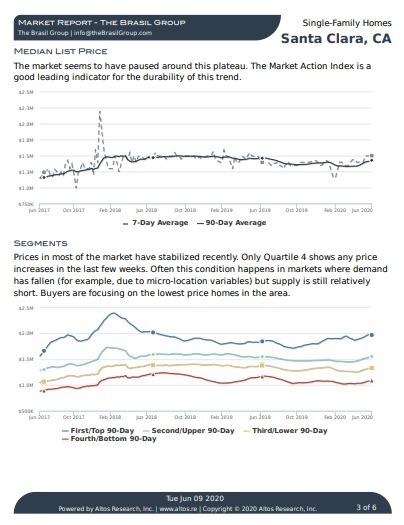
Altos Research Market Data For Santa Clara
What we can expect for July’s closings is that the market has leveled off in terms of home values. During June homes were still selling within 2 weeks of being listed, but with fewer offers that were received in previous months.
Sales prices were in line with recent previous sales comparables.
Inventory for June stayed fairly consistent throughout the month, hovering around 50 homes for sale. If this number had increased I would have expected the market to stall causing homes to take longer to sale and eventually leading to price drops.
But that hasn’t happened.
Santa Clara Market Reports
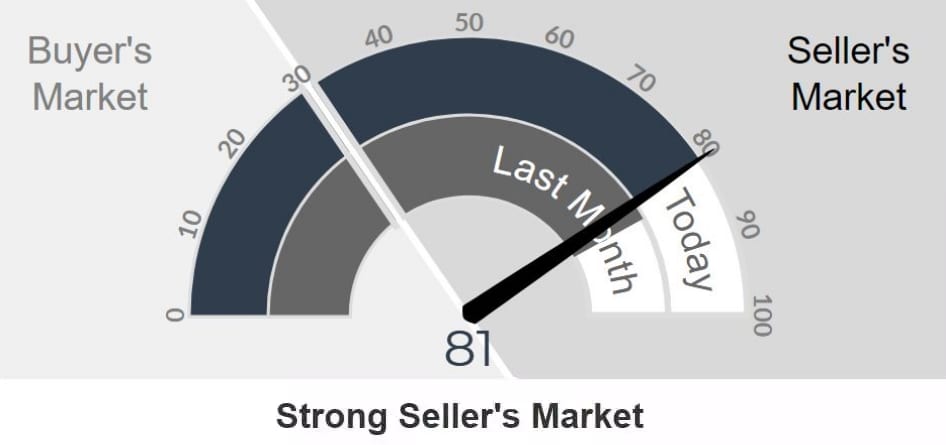
The Altos Research Market Action Index for single-family homes in Santa Clara has decreased to 81 from 83 where it was last month. For more detailed reports on Santa Clara and Santa Clara Zip codes, you can access the reports here.
Santa Clara Report
95051 Report
95050 Report
95054 Report
This time of year Inventory of homes for sale is generally increasing month after month.
That has yet to happen this July, as buyers continue to absorb new inventory and new listings are really not hitting the market as they have in the past.
As of right now, there are roughly 40 homes on the market in Santa Clara. That number has dipped down from 50 homes just a week prior. Part of the reason is the major July 4th holiday.
Now that the major holiday is behind us, it will be interesting to see if inventory starts to pick up.
Mortgage rates have settled back down from a recent climb but have not dropped to their beginning of the year lows. With the economy heating up there is speculation that they can only go up from here.
The stock market has also been making new highs in recent weeks but trading volume has been low.
With the recent stock market performance and current interests rates there is little concern that the economy will slow down the housing market. All that we can monitor at this point is inventory levels of homes for sale.
Save thousands when you sell.
Includes Free Staging and Our Complete Selling Solution
* Total commission 4% including buyer side agent commission of 2.5%, offer varies by value of home.
what can we expect moving forward?
Buyers, home values are not increasing like in previous months. In some segments of our market, such as smaller entry-level homes home prices have even settled down a bit off their highs.
There are still a fair amount of buyers competing, and open houses are almost back to pre-COVID attendance numbers.
Upper-end segments of Santa Clara are very strong as these neighborhoods have even fewer available homes for sale.
Understand that the best prospects of finding a home will be in the next few months before inventory starts to drop for the holidays.
Sellers, generally at this time of year if you were planning to list, I would have told you that you missed your opportunity.
However, the market is surprisingly holding up and not showing any signs of a drop. That could of course change if the market receives an influx of listings in the coming weeks, but we have yet to see that and it’s looking very likely that it may not happen this year.
If for some reason this is the year you want to sell, the Summer and Fall are likely to be a good market to get your home sold for a great price in just a few weeks.
As always, whether you are buying or selling, be sure to understand how your home or the property you are considering ranks in the current market. Understanding the Santa Clara housing market is important when determining the right price and solid home investment.
If you have any questions about a home on the market or your home’s value, please feel free to reach out, I am happy to hear from you.
Contact Me Today
Have a question? Interested in setting an appointment to talk about your real estate plans? Contact me today.
-
VINICIUS BRASIL, Realtor
Keller Williams - The Brasil Group
19400 Stevens Creek Blvd #200
Cupertino, CA 95014 - 408.582.3272
- Schedule a meeting

Santa Clara June 2021 Home Sales
| Street Address | List Price | Price | DOM | Beds Total | Bths | Sq Ft Total | Age |
| 3575 Mauricia Avenue | $3,238,888 | $3,180,000 | 47 | 4 | 3|1 | 3,255 | 2 |
| 3560 Mauricia Avenue | $2,679,000 | $2,809,809 | 7 | 4 | 3|1 | 2,200 | 0 |
| 2841 Mesquite Drive | $2,198,888 | $2,568,000 | 7 | 4 | 2|0 | 1,785 | 46 |
| 967 Wood Duck Avenue | $2,388,000 | $2,470,000 | 8 | 5 | 3|1 | 2,506 | 60 |
| 3766 Thrush Way | $1,899,000 | $2,450,000 | 6 | 4 | 2|0 | 1,568 | 60 |
| 319 Manzanita Avenue | $1,999,950 | $2,310,000 | 10 | 4 | 2|1 | 1,810 | 58 |
| 1825 Worthington Circle | $2,190,000 | $2,262,250 | 11 | 4 | 2|1 | 2,717 | 7 |
| 2600 Neves Court | $1,798,000 | $2,225,000 | 4 | 3 | 2|0 | 1,754 | 45 |
| 490 Saratoga Avenue | $2,199,950 | $2,200,000 | 4 | 5 | 3|1 | 3,404 | 70 |
| 3816 Shasta Drive | $1,950,888 | $2,200,000 | 10 | 4 | 2|0 | 1,712 | 62 |
| 3509 Oxford Ct | $2,089,950 | $2,190,000 | 6 | 5 | 3|0 | 2,272 | 61 |
| 590 Monroe Street | $1,988,000 | $2,123,000 | 10 | 5 | 3|0 | 2,487 | 116 |
| 2817 Sycamore Way | $1,700,000 | $2,000,000 | 9 | 4 | 2|0 | 1,854 | 61 |
| 1882 Homestead Road | $1,958,000 | $2,000,000 | 2 | 4 | 3|0 | 1,945 | 71 |
| 954 Teal Drive | $1,800,000 | $1,915,000 | 10 | 3 | 2|0 | 1,388 | 60 |
| 3056 Via Siena Place | $1,880,000 | $1,910,000 | 10 | 3 | 2|1 | 1,762 | 6 |
| 2949 Miles Drive | $1,598,000 | $1,905,000 | 7 | 3 | 2|0 | 1,398 | 64 |
| 2235 Denise Drive | $1,699,800 | $1,900,000 | 6 | 3 | 2|0 | 1,883 | 57 |
| 631 Hillsdale Avenue | $1,849,999 | $1,900,000 | 20 | 4 | 2|0 | 1,782 | 65 |
| 2643 Toledo Avenue | $1,688,000 | $1,900,000 | 11 | 3 | 2|0 | 1,657 | 67 |
| 1720 Franck Avenue | $1,598,000 | $1,850,000 | 6 | 3 | 2|0 | 1,716 | 68 |
| 975 Hilmar Street | $1,699,999 | $1,850,000 | 4 | 4 | 3|0 | 1,868 | 68 |
| 2762 Glorietta Circle | $1,550,000 | $1,750,000 | 0 | 4 | 2|0 | 1,572 | 50 |
| 754 Ridge Road | $1,399,000 | $1,750,000 | 8 | 4 | 2|0 | 1,310 | 66 |
| 627 Bucher Avenue | $1,770,000 | $1,725,000 | 26 | 3 | 2|0 | 1,355 | 67 |
| 1917 Fillmore Street | $1,399,000 | $1,725,000 | 8 | 3 | 2|0 | 1,395 | 66 |
| 3467 Flora Vista Avenue | $1,488,888 | $1,710,000 | 12 | 3 | 2|0 | 1,212 | 67 |
| 2284 Forbes Avenue | $1,588,000 | $1,700,000 | 7 | 3 | 2|0 | 1,536 | 66 |
| 2050 Coolidge Dr | $1,479,000 | $1,700,000 | 8 | 3 | 2|0 | 1,181 | 58 |
| 937 Perreira Drive | $1,698,000 | $1,700,000 | 5 | 3|0 | 2,411 | 57 | |
| 3679 De La Cruz Boulevard | $1,498,000 | $1,700,000 | 17 | 4 | 3|0 | 1,865 | 52 |
| 3469 Flora Vista Avenue | $1,488,888 | $1,690,000 | 12 | 3 | 2|0 | 1,212 | 67 |
| 2622 Toledo Avenue | $1,499,999 | $1,673,800 | 8 | 3 | 2|0 | 1,340 | 64 |
| 2331 Rosita Avenue | $1,448,000 | $1,625,000 | 6 | 3 | 2|0 | 1,140 | 66 |
| 5022 Avenida De Lago | $1,549,000 | $1,620,000 | 15 | 3 | 2|0 | 1,710 | 45 |
| 3062 Butte Street | $1,395,000 | $1,610,000 | 11 | 3 | 2|0 | 1,800 | 73 |
| 2248 Bray Avenue | $1,450,000 | $1,600,000 | 6 | 3 | 2|0 | 1,119 | 70 |
| 3025 Dibble Court | $1,378,000 | $1,550,000 | 1 | 4 | 2|0 | 1,092 | 68 |
| 2757 El Sobrante Street | $1,399,000 | $1,540,145 | 0 | 3 | 1|0 | 1,210 | 65 |
| 2961 Miles Drive | $1,598,000 | $1,500,000 | 11 | 4 | 2|0 | 1,398 | 64 |
| 2395 Cimarron Drive | $1,350,000 | $1,500,000 | 7 | 4 | 2|0 | 1,288 | 53 |
| 1898 Andrea Place | $1,249,950 | $1,500,000 | 7 | 3 | 1|0 | 1,242 | 61 |
| 2237 Duvall Court | $1,388,000 | $1,500,000 | 7 | 3 | 2|1 | 1,667 | 23 |
| 2381 Cabrillo Avenue | $1,299,800 | $1,488,000 | 15 | 3 | 2|0 | 1,020 | 60 |
| 2276 Lenox Place | $1,298,000 | $1,475,000 | 18 | 3 | 2|1 | 1,667 | 23 |
| 2341 Fatjo Place | $1,198,000 | $1,461,000 | 7 | 3 | 1|0 | 1,021 | 71 |
| 2359 Thompson Place | $1,189,000 | $1,450,000 | 3 | 1|0 | 1,021 | 71 | |
| 752 Scott Boulevard | $1,499,950 | $1,450,000 | 24 | 4 | 2|0 | 1,830 | 74 |
| 725 Raney Court | $1,399,950 | $1,445,000 | 8 | 3 | 2|0 | 1,242 | 66 |
| 3548 Cecil Avenue | $1,260,000 | $1,439,000 | 7 | 2 | 1|1 | 1,184 | 70 |
| 1398 Mcpherson Street | $1,388,000 | $1,435,000 | 10 | 3 | 2|0 | 1,166 | 67 |
| 2178 Esperanca Avenue | $1,398,000 | $1,425,000 | 10 | 4 | 2|1 | 1,705 | 21 |
| 3380 Granada Avenue | $1,299,999 | $1,420,000 | 9 | 3 | 2|0 | 1,166 | 67 |
| 1959 Jackson Street | $1,299,900 | $1,400,000 | 11 | 3 | 2|0 | 1,499 | 67 |
| 2292 Benton Street | $1,350,000 | $1,350,000 | 9 | 3 | 2|0 | 1,257 | 70 |
| 1279 Harrison Street | $1,198,000 | $1,338,000 | 6 | 4 | 2|1 | 1,802 | 38 |
| 1183 Inverness Avenue | $1,200,000 | $1,302,000 | 3 | 2 | 1|1 | 1,231 | 72 |
| 2023 Bray Avenue | $1,299,000 | $1,300,000 | 11 | 3 | 1|0 | 1,458 | 70 |
Santa Clara Housing Market Archive
May 2021 home sales CLICK HERE.
April 2021 home sales CLICK HERE.
March 2021 home sales CLICK HERE.
February 2021 home sales CLICK HERE.
January 2021 home sales CLICK HERE.
November 2020 home sales CLICK HERE.
October 2020 home sales CLICK HERE.
September 2020 home sales CLICK HERE.
August 2020 home sales CLICK HERE.
July 2020 home sales CLICK HERE.
June 2020 home sales CLICK HERE.
May 2020 home sales CLICK HERE.
April 2020 home sales CLICK HERE.
March 2020 home sales CLICK HERE.
January 2020 home sales CLICK HERE.
