November Santa Clara Home Sales Recap
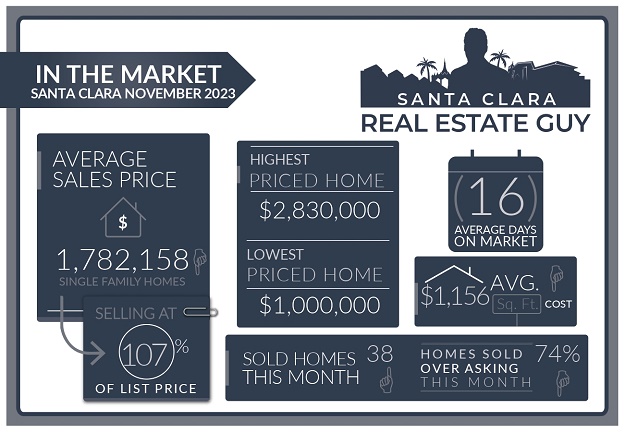
The Santa Clara housing market in November experienced 38 single-family homes that closed escrow, which is 4 more than closed escrow in the previous month of October. For some more perspective, last year there were 21 homes sold in November.
The average price of a home sold in November was $1.78M which is about $53K lower than the previous month’s figure of $1.84M. The median price home sold was $1.72M, about $83K higher than the median price in October.
The average cost per square foot saw a decrease from $1255 per Sq. Ft. to $1156 per Sq. Ft.
Of all the 38 homes sold in November, 28 homes sold over the list price. On average homes that sold did so at 7.36% over asking compared to 7.88% over asking in the previous month.
We started the month of November with 34 active single-family home listings and finished with 22 active single-family homes for sale in all of Santa Clara.
There were 30 single-family homes that accepted contracts in the month of November and 22 new single-family home listings that were listed in November.
For a list of sold homes in November click here or scroll down to the bottom of the page.
Number of Home Sales Down, Market Up
For the first time this year we saw more home sales in a particular month than the same month of the previous year. 38 homes sold this November versus just 21 homes sold November of 2022.
That uptick in sales certainly helped inventory drop for the month of December to levels that we typically see this time of year.
With such low levels of inventory the market is guaranteed to be tight, with lots of competition among home buyers.
Home Inventory is Low
It’s December and that means low inventory, and on top of that not very many good homes on the market. Generally the best homes will be sold in the Spring and Summer months. There are exceptions of course, but with around 20 single family homes for sale finding that right home can be a challenge.
Altos Research Market Data For Santa Clara
Multiple Offers and Home Values
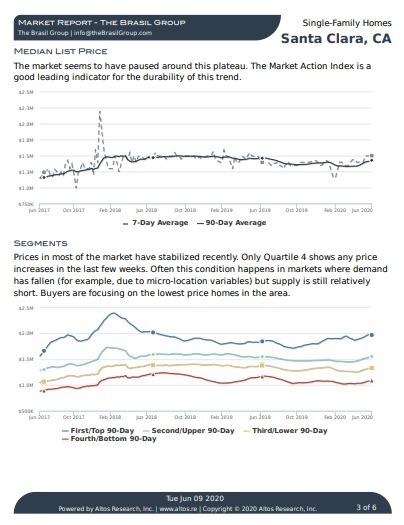
Lower inventory generally means a tighter market where homes are selling quickly and prices are increasing, and that is the case with our current market.
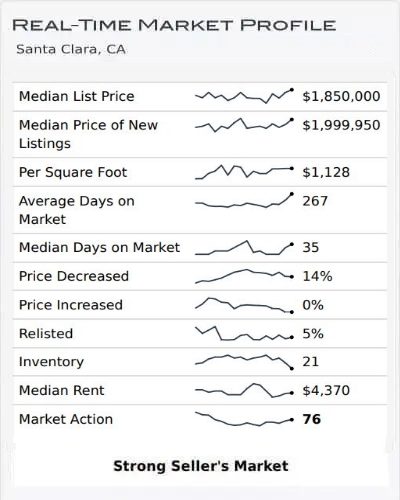
One easy way to track the market is with the Altos Research – Market Action Index (MAI). The MAI is a proprietary metric that measures inventory and sales activity. The MAI was trending upward indicating that the market is getting stronger for sellers.
MAI has been trending upward in the last few weeks indicating the market is strengthening for sellers. Currently, the MAI is around 76 indicating a strong SELLER’S MARKET.
Santa Clara Market Reports
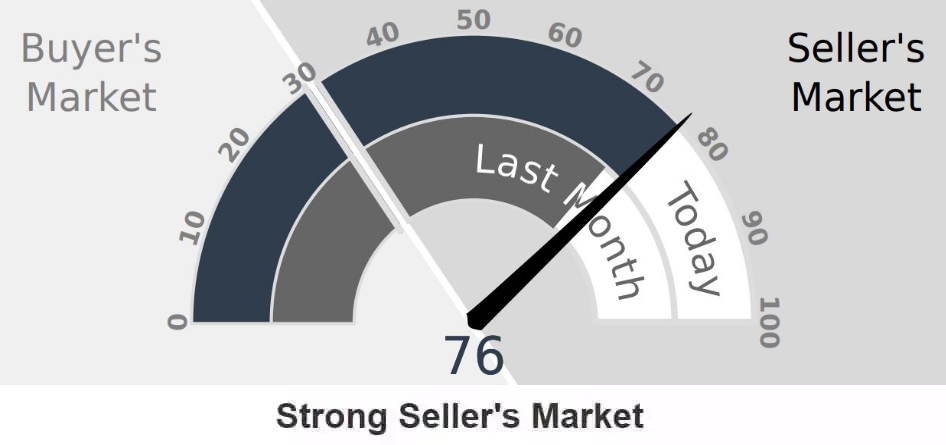
The Altos Research Market Action Index for single-family homes in Santa Clara has increased to 76 from 69 where it was last month. For more detailed reports on Santa Clara and Santa Clara Zip codes, you can access the reports here.
Santa Clara Report
95051 Report
95050 Report
95054 Report
Home Values on the Rise
With current low inventory levels home values have been rising. The number of buyers looking right now are out numbering available homes, especially desirable homes and homes in desirable neighborhoods.
Also adding fuel to the market are interest rates. Interest rates have settled from their highs, and seem to be trending downward.
Other Factors Influencing the Market:
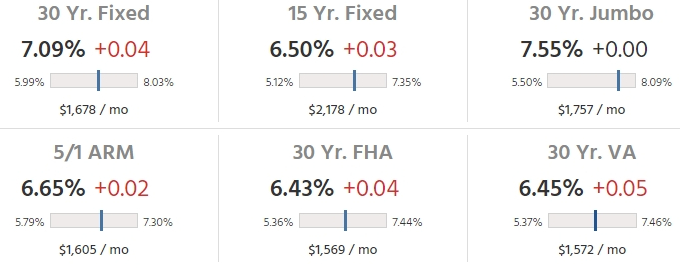
Mortgage rates have settled down to the low 7’s nationally for a 30-year fixed. Just two weeks prior rates were above 8%.
As the economy weakens expect rates to drop further.
Update: Rates have dropped a half a point in the last two days, and are now in the mid-6% range.
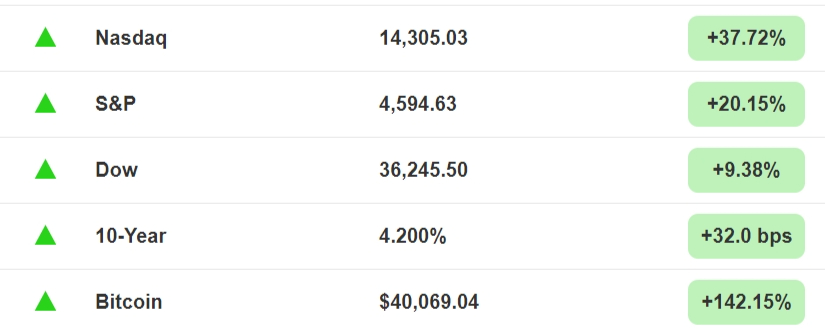
Markets Year to Date
The stock market has climbed to highs for the year after several months of an up and down market. Best performing stocks continue to be tech stocks, specifically firms with a focus on AI with Santa Clara’s Nvidia leading the way.
Home buyers in our local market rely on tech stocks values for their down payment and for their loan qualifications. The impact on stock values affects home buyer affordability and purchasing power.
Save thousands when you sell.
Includes Free Staging and Our Complete Selling Solution
* Total commission 4% including buyer side agent commission of 2.5%, offer varies by value of home.
What to Expect Moving Forward
Buyers, homes are selling fast and inventory is limited.
If you follow real estate you will know the Winter market is where the market will tighten and prices could start to shoot up.
When considering the factors of rates dropping, stock values increasing, and low inventory things seem to be shaping up for a hot sellers market.
The weakening of the economy may concern some. How you feel about the current state of the economy may depend on what you are reading or how the stock market is performing.
Many feel the economy is moving, and that the FED scenario for a soft landing is looking very likely. I don’t share this belief, but it’s very difficult to explain the current economic situation even more so in Silicon Valley which tends to have its own economic cycles separate from the US and the global economy.
My advice to buyers is to continue to shop but be cautious. I expect the market to heat up in the next few months but with rates still relatively high affordability is still a concern for many. Also, the stock market is treading in new highs, which will likely experience resistance moving forward.
Sellers, you can’t ask for a better time to get your home on the market.
Inventory is low, stock values are high, and interest rates although high, have dropped a bit providing some relief.
I really don’t think the conditions for selling are going to get any better in 2024.
A lot is going on right now in the economy. Some foreign economies are in deep recession, China is doing poorly, and overall you can expect the downturn to start hitting the US economy.
We have seen a few bank failures, and some experts expect more are likely to come.
There could be a situation where we do start to see weakness in the system and the market slows. So there is some risk here.
My advice to sellers is if you want to make a move especially if you are thinking of making a move to a market where there is more new construction and supply of homes like Nevada, Idaho, and Texas then this market may be a great opportunity.
These markets are much slower than our current market, with lots of inventory, and home values have already dropped considerably from their highs. As a buyer, you may be able to make contingent offers on new homes enabling you to sell your home before buying a new home.
There are many reasons why selling and buying in a slow market makes sense. Here is an article I wrote on the advantages of selling in slow markets.
Instead of offering general suggestions here, I would encourage sellers who have questions and concerns about selling in this market to reach out to an agent.
Understanding your specific situation helps in determining how this market will affect you and your options. I offer free consultations to buyers and sellers to discuss their needs, so please reach out, I am always happy to help.
Conclusion:
As always, whether you are buying or selling, understanding the current market will set you up for success. As I mentioned above some homes are doing quite well in this market.
Understand that the housing stock of Santa Clara is very diverse and can vary greatly from one neighborhood to the next.
Developing the right strategy for you, whether you are buying a home or thinking of selling your current home is important to succeeding in this market.
If you have any questions about a home on the market or your home’s value, please feel free to reach out, I am happy to meet and help you understand your options.
Contact Me Today
Have a question? Interested in setting an appointment to talk about your real estate plans? Contact me today.

Message Me Directly:
Santa Clara November 2023 Home Sales
| Street Address | List Price | Price | DOM | Beds Total | Bths | Sq Ft Total | Age |
| 2762 Glorietta Cir | $2,398,000 | $2,830,000 | 9 | 4 | 2|0 | 1,572 | 52 |
| 732 Pritchard Court | $2,498,000 | $2,580,000 | 9 | 6 | 4|1 | 3,139 | 68 |
| 3759 BENTON Street | $2,568,000 | $2,480,000 | 125 | 4 | 2|1 | 2,701 | 30 |
| 3719 Benton Street | $2,298,000 | $2,300,000 | 3 | 4 | 2|0 | 1,880 | 62 |
| 543 Flannery Street | $1,800,000 | $2,280,000 | 12 | 4 | 2|1 | 1,749 | 60 |
| 762 Viader Court | $2,299,000 | $2,280,000 | 16 | 4 | 2|1 | 1,805 | 76 |
| 349 Howard Drive | $1,698,000 | $2,210,000 | 7 | 6 | 3|0 | 2,043 | 65 |
| 3866 Baldwin Drive | $1,899,950 | $2,195,000 | 8 | 3 | 2|0 | 1,508 | 65 |
| 3212 Loma Alta Drive | $1,999,950 | $2,035,000 | 15 | 4 | 2|0 | 1,700 | 60 |
| 2165 Denise Drive | $1,799,000 | $1,975,000 | 7 | 4 | 2|1 | 2,058 | 60 |
| 462 Juanita Drive | $1,995,000 | $1,925,000 | 23 | 3 | 2|1 | 1,440 | 71 |
| 3486 Flora Vista Avenue | $1,638,000 | $1,805,000 | 7 | 4 | 3|0 | 1,623 | 69 |
| 2422 Borax Drive | $1,428,000 | $1,800,000 | 6 | 3 | 2|0 | 1,383 | 68 |
| 2151 Briarwood Drive | $1,600,000 | $1,800,000 | 8 | 3 | 2|0 | 1,240 | 67 |
| 4198 Tobin Circle | $1,688,000 | $1,780,000 | 15 | 3 | 3|0 | 1,590 | 21 |
| 2229 Stebbins Avenue | $1,699,000 | $1,769,000 | 5 | 4 | 2|0 | 1,315 | 64 |
| 1938 Murguia Avenue | $1,498,000 | $1,730,000 | 5 | 3 | 2|0 | 1,400 | 76 |
| 761 San Miguel Avenue | $1,788,000 | $1,725,000 | 25 | 4 | 2|1 | 1,954 | 69 |
| 4393 Laird Circle | $1,679,000 | $1,720,000 | 13 | 3 | 3|0 | 1,590 | 18 |
| 930 Poplar Street | $1,749,900 | $1,715,000 | 28 | 4 | 2|1 | 1,727 | 77 |
| 2957 Kearney Avenue | $1,399,800 | $1,620,000 | 8 | 4 | 2|0 | 1,095 | 65 |
| 3489 Cabrillo Avenue | $1,499,000 | $1,620,000 | 5 | 3 | 2|0 | 1,564 | 67 |
| 2340 Raggio Avenue | $1,599,000 | $1,620,000 | 6 | 3 | 1|1 | 1,287 | 71 |
| 2416 Austin Place | $1,498,000 | $1,615,000 | 6 | 3 | 2|0 | 1,170 | 68 |
| 2149 Stebbins Avenue | $1,499,950 | $1,615,000 | 9 | 3 | 2|0 | 1,591 | 64 |
| 1884 Clay Street | $1,499,000 | $1,608,000 | 12 | 3 | 2|0 | 1,314 | 77 |
| 3472 Gibson Avenue | $1,298,000 | $1,585,000 | 9 | 3 | 2|0 | 1,461 | 67 |
| 1149 Scott Boulevard | $1,550,000 | $1,575,000 | 68 | 3 | 3|1 | 1,764 | 74 |
| 2364 Donner Place | $1,298,000 | $1,570,000 | 8 | 4 | 2|0 | 1,350 | 68 |
| 2619 Painted Rock Drive | $1,398,000 | $1,550,000 | 7 | 3 | 2|0 | 1,393 | 69 |
| 2324 Glendenning Avenue | $1,399,000 | $1,550,000 | 7 | 3 | 2|0 | 1,080 | 69 |
| 1732 Laine Avenue | $1,350,000 | $1,505,000 | 5 | 4 | 2|0 | 1,423 | 71 |
| 2435 Armstrong Place | $1,525,000 | $1,500,000 | 50 | 3 | 2|0 | 1,231 | 67 |
| 1171 Blackfield Drive | $1,299,000 | $1,430,000 | 2 | 3 | 2|0 | 1,134 | 68 |
| 2462 Scanlan Place | $1,699,000 | $1,400,000 | 29 | 3 | 2|0 | 2,104 | 67 |
| 1226 Lincoln Street | $1,398,000 | $1,325,000 | 34 | 3 | 2|0 | 1,710 | 110 |
| 623 Malarin Avenue | $1,100,000 | $1,100,000 | 2 | 3 | 1|0 | 980 | 72 |
| 1890 Matos Court | $1,000,000 | $1,000,000 | 13 | 3 | 2|1 | 1,163 | 40 |
Santa Clara Housing Market Archive
November 2023 home sales CLICK HERE.
August 2023 home sales CLICK HERE.
July 2023 home sales CLICK HERE.
June 2023 home sales CLICK HERE.
May 2023 home sales CLICK HERE.
April 2023 home sales CLICK HERE.
January 2023 home sales CLICK HERE.
December 2022 home sales CLICK HERE.
November 2022 home sales CLICK HERE.
October 2022 home sales CLICK HERE.
September 2022 home sales CLICK HERE.
August 2022 home sales CLICK HERE.
July 2022 home sales CLICK HERE.
June 2022 home sales CLICK HERE.
April 2022 home sales CLICK HERE.
March 2022 home sales CLICK HERE.
February 2022 home sales CLICK HERE.
December 2021 home sales CLICK HERE.
November 2021 home sales CLICK HERE.
October 2021 home sales CLICK HERE.
September 2021 home sales CLICK HERE.
July 2021 home sales CLICK HERE.
May 2021 home sales CLICK HERE.
April 2021 home sales CLICK HERE.
March 2021 home sales CLICK HERE.
February 2021 home sales CLICK HERE.
January 2021 home sales CLICK HERE.
November 2020 home sales CLICK HERE.
October 2020 home sales CLICK HERE.
September 2020 home sales CLICK HERE.
August 2020 home sales CLICK HERE.
July 2020 home sales CLICK HERE.
June 2020 home sales CLICK HERE.
May 2020 home sales CLICK HERE.
April 2020 home sales CLICK HERE.
March 2020 home sales CLICK HERE.
January 2020 home sales CLICK HERE.
