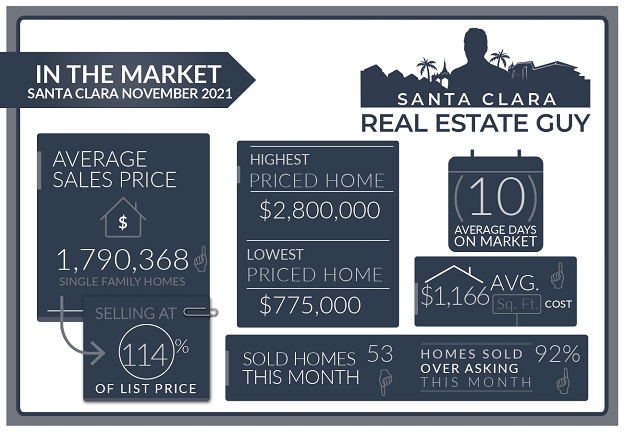
The Santa Clara housing market in November experienced 53 single-family homes that closed escrow, which is 8 less that closed escrow than in the previous month of October.
The average price of a home sold in November was $1.79M which is about $128K higher than last month’s figure of $1.66M. The median price home sold was $1.72M, about $140K higher than the median price in October.
The average cost per square foot saw a slight increase from $1093 per Sq. Ft. to $1166 per Sq. Ft. Of the 53 homes sold in November, 49 sold over the list price.
On average homes that sold did so at 13.94% over asking compared to 10.17% over asking in the previous month.
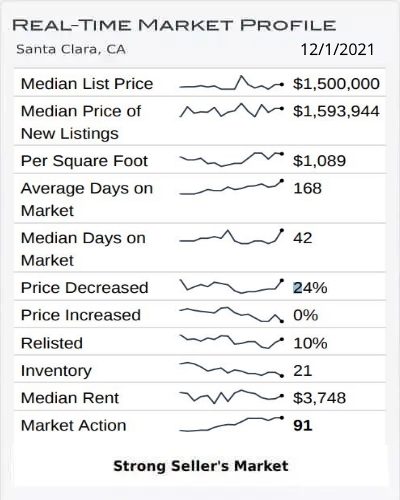
We started the month of November with 27 active single-family home listings and finished with 17 single family homes for sale in all of Santa Clara.
Santa Clara Home Values Shooting Upwards
For several weeks straight the inventory of homes for sale has been declining and buyers are responding with some very high offers.
Currently, there are about 15 homes on the market in all of Santa Clara, and that number has been fluctuating between 10 and 15 in the last week.
Altos Research Market Data For Santa Clara
Buyers are Anxious
Buyers who are opting to purchase now are anticipating what will likely be more price increases in the beginning of the year when inventory is likely to drop below 10 homes for sale.
The aggressive bidding has resulted in new record prices across multiple neighborhoods in Santa Clara.
Sellers are generally weary of selling their homes during the holidays.
On a national level the market does slow down quite a bit.
Our local market doesn’t follow this trend, making the holiday season a good opportunity to sell due to low competition.
For more information about selling in the winter or holiday season, check out our post Best Time To Sell a Home in Santa Clara.
Santa Clara Market Reports
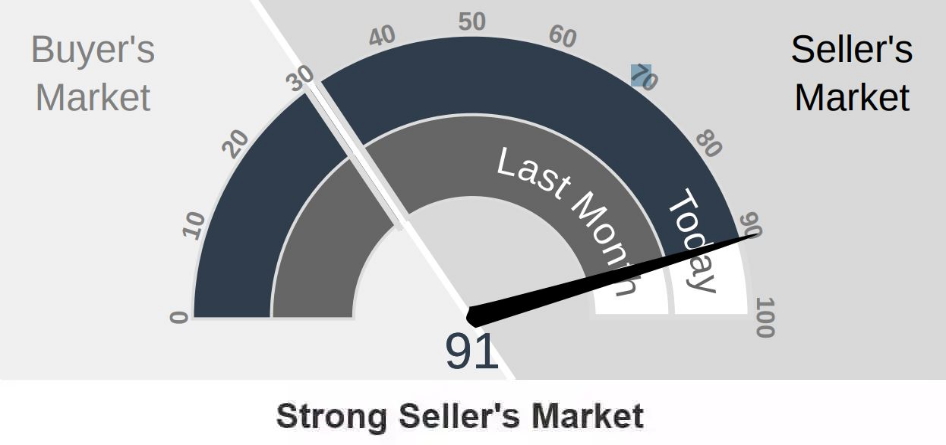
The Altos Research Market Action Index for single-family homes in Santa Clara has increased to 91 from 90 where it was last month. For more detailed reports on Santa Clara and Santa Clara Zip codes, you can access the reports here.
Santa Clara Report
95051 Report
95050 Report
95054 Report
Seasonal Trends:
The holidays mean low inventory and in our market, that can result in higher prices.
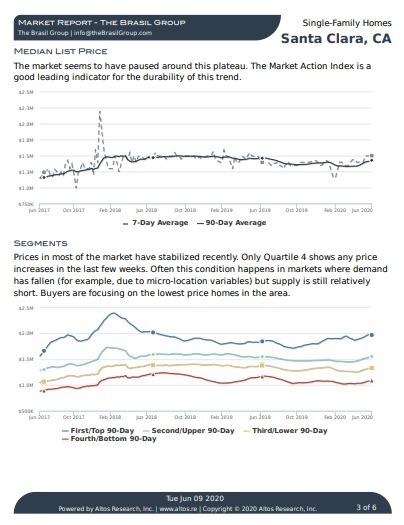
In previous years where there has been a market correction in the Summer, pricing would stabilize by the time the holidays arrived, and more than likely we would see the market start to rebound at the beginning of the year.
In spite of there being little inventory on the market, there are still a number of homes that have been listed for several weeks and even months.
Buyers are still holding out for the right home, but with prices increasing so substantially some of these sitting homes will likely start to receive offers.
Other Factors in the Market:
Mortgage rates continue to inch higher.
Rates are still extremely low and buyers are still able to lock in rates below 3%.
As prices have moved up sharply, many buyers are deciding to use 7 or 10 year fixed loans, which will remain at a fixed rate for the first few years then become variable.
The stock market has been selling off for several weeks and just started to rebound, in low volume- an indication of the uncertainty regarding the FED.
The FED is still positioning to start tapering the QE program and have hinted that it may accelerate the amount of tapering.
This to me would be the biggest impact to our local market as interest rates would certainly jump and the stock market would experience some strong selling, affecting confidence in the economy.
Predictions for next year are that housing will remain strong, but appreciation will be much lower. The condo market will start to rebound next year as well as the rental market.
Save thousands when you sell.
Includes Free Staging and Our Complete Selling Solution
* Total commission 4% including buyer side agent commission of 2.5%, offer varies by value of home.
What Can We Expect Moving Forward?
Buyers, if you are trying to buy a home right now you can expect heavy competition and there is a good chance that even if you make a strong offer it may not be enough.
One thing that seems certain- home values will not be dropping any time soon (at least for the next month) and it is likely that prices will continue to go up in the beginning of the year.
As a buyer in this market, be clear on your goals and what you are looking for. Although you may not be able to find a “good deal” in this market, you can protect yourself from a bad one.
Sellers, contrary to what you may have read or heard, this time of year is a good time to sell your home. Inventory is extremely low, so your home has a better possibility of standing out even without repairs and updates.
If you are waiting for the Spring, you may want to consider selling earlier. The main factors will be the condition of your home and how it will perform in a more crowded market.
It’s important to understand how your home relates to this market in order to determine the right strategy to get your home sold for top value.
Conclusion:
As always, whether you are buying or selling, understanding the current market and how your home relates will set you up for success. The housing stock of Santa Clara is very diverse and can vary greatly from one neighborhood to the next.
Developing the right strategy for your home will maximize your ability to sell for top value.
If you have any questions about a home on the market or your home’s value, please feel free to reach out, I am happy to hear from you.
Contact Me Today
Have a question? Interested in setting an appointment to talk about your real estate plans? Contact me today.
-
VINICIUS BRASIL, Realtor
Keller Williams - The Brasil Group
19400 Stevens Creek Blvd #200
Cupertino, CA 95014 - 408.582.3272
- Schedule a meeting

Message Me Directly:
Santa Clara November 2021 Home Sales
| Street Address | List Price | Price | DOM | Beds Total | Bths | Sq Ft Total | Age |
| 3754 Benton Street | $2,288,000 | $2,800,000 | 6 | 5 | 3|0 | 2,630 | 26 |
| 2647 Birchtree Lane | $2,298,000 | $2,800,000 | 9 | 5 | 4|0 | 3,234 | 49 |
| 2672 Tuliptree Lane | $1,998,000 | $2,600,000 | 7 | 4 | 2|0 | 2,775 | 50 |
| 1216 Doyle Circle | $2,150,000 | $2,420,000 | 7 | 3 | 2|1 | 2,331 | 19 |
| 476 Giannini Drive | $2,150,000 | $2,400,000 | 7 | 5 | 3|0 | 2,331 | 62 |
| 3887 Shasta Drive | $1,899,000 | $2,370,000 | 7 | 3 | 2|0 | 1,508 | 62 |
| 752 Cornell Drive | $1,998,000 | $2,350,000 | 6 | 5 | 3|0 | 2,102 | 60 |
| 3032 Via Siena Place | $1,880,000 | $2,270,000 | 9 | 4 | 2|1 | 1,957 | 6 |
| 739 Yale Lane | $1,695,000 | $2,210,000 | 8 | 3 | 2|0 | 1,442 | 60 |
| 3445 Bonita Avenue | $1,990,000 | $2,200,000 | 8 | 4 | 3|0 | 1,964 | 66 |
| 3368 Vanderbilt Way | $1,688,000 | $2,188,000 | 7 | 3 | 2|0 | 1,302 | 60 |
| 3261 Catalina Avenue | $1,599,000 | $2,150,000 | 6 | 3 | 2|0 | 1,496 | 58 |
| 635 Giannini Drive | $1,799,000 | $2,025,000 | 3 | 3 | 2|0 | 1,147 | 65 |
| 2952 Humbolt Avenue | $1,438,000 | $2,015,000 | 7 | 2 | 1|0 | 1,562 | 70 |
| 2807 Sycamore Way | $1,675,000 | $1,950,000 | 0 | 3 | 2|0 | 1,442 | 61 |
| 265 Tyler Avenue | $1,888,000 | $1,915,000 | 57 | 3 | 2|0 | 2,024 | 72 |
| 2385 Alberta Court | $1,900,000 | $1,915,000 | 8 | 4 | 2|0 | 2,000 | 60 |
| 2529 Moraine Drive | $1,688,000 | $1,868,000 | 11 | 3 | 3|0 | 1,396 | 67 |
| 1470 Los Padres Blvd | $1,688,000 | $1,850,000 | 13 | 4 | 2|1 | 2,383 | 66 |
| 389 Drake Ct | $1,850,000 | $1,850,000 | 67 | 3 | 3|0 | 1,893 | 66 |
| 3408 Saint Marys Place | $1,768,888 | $1,810,000 | 42 | 5 | 3|0 | 2,352 | 64 |
| 2789 Rebeiro Avenue | $1,575,000 | $1,780,000 | 5 | 3 | 2|0 | 1,341 | 66 |
| 1191 Foley Avenue | $1,198,000 | $1,750,000 | 8 | 4 | 2|0 | 1,547 | 65 |
| 237 N Henry Avenue | $1,600,000 | $1,750,000 | 14 | 3 | 2|0 | 1,450 | 0 |
| 3613 Londonderry Drive | $1,749,950 | $1,725,000 | 18 | 3 | 2|0 | 1,642 | 66 |
| 3016 Cameron Way | $1,499,000 | $1,720,000 | 5 | 3 | 2|0 | 1,240 | 67 |
| 2327 Stanford Place | $1,699,950 | $1,720,000 | 8 | 4 | 3|0 | 2,087 | 64 |
| 733 Raney Court | $1,425,000 | $1,675,000 | 6 | 3 | 2|0 | 1,170 | 66 |
| 1337 Kiely Boulevard | $1,498,000 | $1,655,000 | 11 | 4 | 2|0 | 1,626 | 65 |
| 729 Robin Dr | $1,499,999 | $1,655,000 | 7 | 3 | 3|0 | 1,336 | 71 |
| 2168 Avenida De Las Flores | $1,588,888 | $1,643,000 | 8 | 4 | 2|1 | 1,850 | 45 |
| 1037 Blossom Drive | $1,523,000 | $1,625,000 | 8 | 3 | 2|0 | 1,503 | 71 |
| 3557 Golden State Drive | $1,288,000 | $1,605,000 | 6 | 3 | 2|0 | 1,166 | 67 |
| 3421 Bella Vista Avenue | $1,397,888 | $1,605,000 | 5 | 3 | 2|0 | 1,124 | 67 |
| 852 Laurie Avenue | $1,349,888 | $1,600,500 | 5 | 5 | 3|0 | 1,866 | 60 |
| 2136 Ventura Place | $1,299,950 | $1,600,000 | 6 | 3 | 2|0 | 1,078 | 66 |
| 3137 San Juan Avenue | $1,438,000 | $1,580,000 | 12 | 3 | 2|0 | 1,095 | 63 |
| 2181 Bowers Avenue | $1,298,000 | $1,570,000 | 8 | 3 | 2|0 | 1,243 | 62 |
| 2040 Brown Court | $1,399,000 | $1,558,000 | 5 | 3 | 2|0 | 1,095 | 0 |
| 665 Armanini Avenue | $1,500,000 | $1,550,000 | 2 | 3 | 2|0 | 1,162 | 0 |
| 1920 Fillmore Street | $1,358,000 | $1,525,000 | 2 | 3 | 2|0 | 1,558 | 66 |
| 2826 Addison Place | $1,397,888 | $1,525,000 | 8 | 4 | 2|0 | 1,158 | 61 |
| 1742 Laine Avenue | $1,290,000 | $1,508,000 | 8 | 3 | 1|1 | 1,086 | 69 |
| 2911 Monroe St | $1,298,000 | $1,488,000 | 7 | 3 | 2|0 | 1,095 | 63 |
| 2179 Esperanca Avenue | $1,298,888 | $1,468,000 | 7 | 3 | 2|1 | 1,599 | 22 |
| 1729 Laine Avenue | $1,399,000 | $1,425,000 | 13 | 4 | 2|0 | 1,576 | 69 |
| 851 Monroe Street | $1,399,000 | $1,420,000 | 10 | 4 | 2|1 | 1,840 | 13 |
| 1750 Briarwood Drive | $1,098,000 | $1,400,000 | 5 | 3 | 2|0 | 1,212 | 67 |
| 3561 Shafer Drive | $1,190,000 | $1,400,000 | 7 | 3 | 2|0 | 1,166 | 67 |
| 951 Camino Drive | $1,250,000 | $1,350,000 | 2 | 3 | 2|0 | 1,536 | 70 |
| 656 Scott Boulevard | $1,250,000 | $1,200,000 | 2 | 1|0 | 936 | 74 | |
| 2284 Avila Avenue | $1,100,000 | $1,083,000 | 13 | 4 | 2|0 | 1,350 | 70 |
| 1277 Lewis Street | $749,000 | $775,000 | 21 | 2 | 1|0 | 863 | 23 |
Santa Clara Housing Market Archive
November 2021 home sales CLICK HERE.
October 2021 home sales CLICK HERE.
September 2021 home sales CLICK HERE.
July 2021 home sales CLICK HERE.
May 2021 home sales CLICK HERE.
April 2021 home sales CLICK HERE.
March 2021 home sales CLICK HERE.
February 2021 home sales CLICK HERE.
January 2021 home sales CLICK HERE.
November 2020 home sales CLICK HERE.
October 2020 home sales CLICK HERE.
September 2020 home sales CLICK HERE.
August 2020 home sales CLICK HERE.
July 2020 home sales CLICK HERE.
June 2020 home sales CLICK HERE.
May 2020 home sales CLICK HERE.
April 2020 home sales CLICK HERE.
March 2020 home sales CLICK HERE.
January 2020 home sales CLICK HERE.
