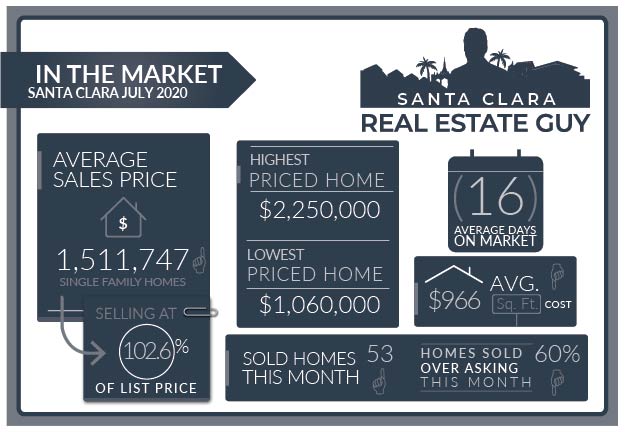
The Santa Clara housing market in July experienced 53 single-family homes that closed escrow, which was considerably more than the 41 which sold in June.
During July there were 59 homes that accepted contracts an increase from the prior month’s 50 homes. During the month there were 72 new active listings that came on the market.
The average price of a home sold in July was $1.51M which is about $40K higher than last month’s figure of $1.47M. The Median price home sold was $1.5M, which is about $100K higher than June’s median price.
The average cost per square foot decreased from $984 per Sq. Ft. to $966. Of the 53 homes sold in July, 32 sold over asking.
On average homes that sold, sold 2.61% over asking compared to 0.34% over asking in the previous month.
We started the month of July with 50 active single-family home listings and finished with 51 in all of Santa Clara.
More transactions and sales in July, as the market heated up in a season where we traditionally experience a market slow down.
The buying activity increased last month but so did the listing activity. 72 homes were listed in July and inventory ended at pretty much the same levels .
The median price of a home sold was higher not necessary just due to more appreciation but larger homes were being sold as evidenced by the lower average price per square foot.
Altos Research Market Data For Santa Clara
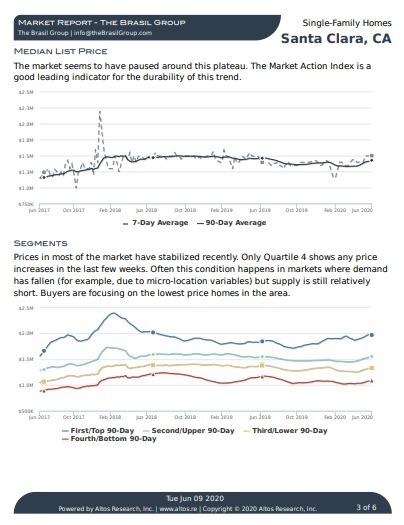
This month inventory operated in a range of 45 to 55 homes on the market. Never dropping below 40 and never reaching 60.
The Santa Clara housing market is very diverse and offers a broad range of homes and neighborhoods. As a result, buyers are focusing more on homes that are move in ready or in highly desirable areas or locations.
Homes that are not presented well, updated, or are affected by an undesirable attribute such as a busy street or noisy location are being looked over and taking much longer to sell.
Santa Clara Market Reports
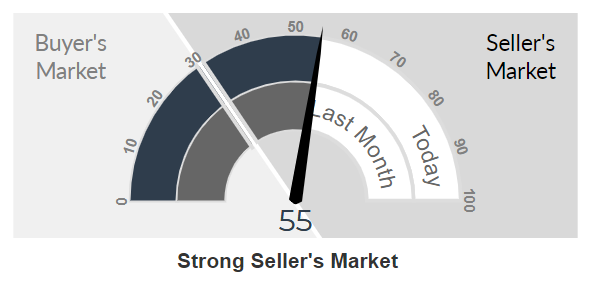
The Altos Research Market Action Index for single-family homes in Santa Clara has held steady at 55 where it was last month. For more detailed reports on Santa Clara and Santa Clara Zip codes, you can access the reports here.
Santa Clara Report
95051 Report
95050 Report
95054 Report
The homes that did sell in July sold on average sold 2.6% over asking, which was higher than last month’s .34% indicating that offers are getting more competitive and bidding is increasing.
Adding to the problems for home buyers is that inventory is roughly about 25% lower than lower than July-August 2019. With limited options, buyers are faced with competing for scarce quality Santa Clara housing.
Buyers, September has been a transition month in previous markets. It has been a month where inventory plateaus and begins to drop. This means moving forward conditions for buyers are not likely to get any better.
To make sure you don’t loose out on any good opportunities, be clear on your objectives and don’t overlook homes that may not be updated but are good buys. Such as homes in sought after neighborhoods, good layout and in good locations.
Sellers, with home inventory staying low the conditions for selling have continued to be favorable. Homes are seeing multiple offers and selling faster than previous months.
Be sure to understand how your home fits in the current market, so you know what improvements you need to make if any to get your home sold quickly and for a great price.
If you have any questions about your home’s value or the current market, please feel free to reach out I am happy to hear from you.
Santa Clara Home Sales July 2020
| Street Address | List Price | Price | DOM | Beds Total | Bths | Sq Ft Total | Age |
| 3172 Mckinley Drive | $1,999,999 | $2,250,000 | 7 | 4 | 3|0 | 2,031 | 63 |
| 3335 Mauricia Avenue | $1,975,000 | $2,050,000 | 14 | 3 | 2|0 | 1,432 | 62 |
| 26 Rodonovan Drive | $1,898,000 | $2,025,000 | 12 | 4 | 2|1 | 1,825 | 67 |
| 3487 Toomey , #homesite 67 | $1,990,000 | $1,990,000 | 26 | 3 | 3|2 | 2,462 | 0 |
| 3874 Pruneridge Avenue | $1,799,950 | $1,920,000 | 8 | 3 | 2|0 | 1,508 | 61 |
| 124 Cronin Drive | $1,850,000 | $1,900,000 | 1 | 3 | 2|0 | 1,388 | 63 |
| 290 Manzanita Avenue | $1,998,000 | $1,900,000 | 7 | 4 | 2|1 | 1,749 | 57 |
| 4321 Marston Lane | $1,830,000 | $1,850,000 | 5 | 4 | 3|1 | 2,083 | 18 |
| 2135 Sherwin Avenue | $1,649,000 | $1,838,000 | 13 | 3 | 2|0 | 1,763 | 2 |
| 2818 Toyon Drive | $1,750,000 | $1,775,000 | 0 | 4 | 2|0 | 2,059 | 45 |
| 875 Circle Drive | $1,789,000 | $1,760,000 | 24 | 4 | 2|1 | 2,372 | 11 |
| 386 Hayes Avenue | $1,700,000 | $1,750,000 | 7 | 4 | 3|0 | 1,662 | 65 |
| 3472 Elmhurst Avenue | $1,710,000 | $1,711,000 | 15 | 3 | 2|0 | 1,292 | 63 |
| 940 Capitola Way | $1,400,000 | $1,650,000 | 10 | 4 | 2|0 | 1,845 | 56 |
| 1006 Capitola Way | $1,111,888 | $1,601,000 | 46 | 5 | 3|0 | 2,411 | 55 |
| 1226 Morton Avenue | $1,495,000 | $1,600,000 | 3 | 3 | 2|0 | 1,867 | 64 |
| 291 Woodhams Road | $1,698,000 | $1,600,000 | 27 | 3 | 2|0 | 1,601 | 66 |
| 656 Malarin Avenue | $1,528,000 | $1,580,000 | 13 | 4 | 2|0 | 1,585 | 69 |
| 688 Monroe Street | $1,650,000 | $1,580,000 | 47 | 4 | 4|0 | 2,783 | 129 |
| 939 Sanchez Place | $1,599,950 | $1,555,000 | 0 | 4 | 3|0 | 2,288 | 0 |
| 4774 Cheeney Street | $1,495,000 | $1,540,000 | 0 | 4 | 2|1 | 2,086 | 22 |
| 3187 Dallas Court | $1,450,000 | $1,535,000 | 11 | 3 | 2|1 | 1,550 | 62 |
| 2086 Dianne Drive | $1,489,000 | $1,530,000 | 8 | 4 | 2|1 | 1,998 | 60 |
| 3464 BONITA Avenue | $1,599,000 | $1,525,000 | 18 | 4 | 3|0 | 1,646 | 64 |
| 2762 Sonoma Place | $1,549,999 | $1,514,101 | 27 | 3 | 2|0 | 1,662 | 65 |
| 2678 Elliot Street | $1,548,000 | $1,510,000 | 23 | 3 | 3|0 | 2,211 | 61 |
| 740 Robin Drive | $1,548,000 | $1,500,000 | 19 | 3 | 2|1 | 1,974 | 70 |
| 1254 Blackfield Drive | $1,499,000 | $1,500,000 | 51 | 3 | 2|0 | 1,516 | 66 |
| 1656 Betty Court | $1,499,999 | $1,475,000 | 13 | 4 | 3|0 | 1,917 | 63 |
| 2512 Rose Way | $1,399,999 | $1,465,000 | 8 | 3 | 2|0 | 1,517 | 65 |
| 5049 Avenida De Lago | $1,325,000 | $1,460,000 | 10 | 5 | 3|0 | 1,850 | 44 |
| 4202 Tobin Circle | $1,399,900 | $1,437,500 | 8 | 3 | 3|1 | 1,657 | 18 |
| 2881 Mark Avenue | $1,349,000 | $1,400,000 | 12 | 3 | 2|0 | 1,237 | 62 |
| 3434 Victoria Avenue | $1,299,950 | $1,365,000 | 8 | 3 | 2|0 | 1,559 | 66 |
| 2013 Cabrillo Court | $1,350,000 | $1,360,000 | 16 | 4 | 2|0 | 1,368 | 60 |
| 2586 Dixon Drive | $1,299,000 | $1,350,000 | 17 | 3 | 2|0 | 1,166 | 65 |
| 2225 Gianera Street | $1,280,000 | $1,350,000 | 11 | 4 | 2|1 | 1,599 | 21 |
| 2464 Brannan Place | $1,195,000 | $1,331,000 | 8 | 3 | 2|0 | 1,231 | 64 |
| 749 Bucher Avenue | $1,295,000 | $1,295,000 | 13 | 3 | 2|0 | 1,390 | 66 |
| 3256 El Sobrante Street | $1,338,800 | $1,280,000 | 40 | 2 | 1|0 | 896 | 71 |
| 2445 Alvarado Drive | $1,299,000 | $1,280,000 | 59 | 4 | 2|0 | 1,288 | 52 |
| 2170 San Rafael Avenue | $1,299,000 | $1,275,000 | 13 | 3 | 2|0 | 1,300 | 65 |
| 1602 Eisenhower Drive | $1,350,000 | $1,270,000 | 20 | 4 | 3|0 | 2,050 | 60 |
| 683 Bucher Avenue | $1,248,000 | $1,268,000 | 6 | 3 | 1|0 | 1,124 | 66 |
| 2533 Hayward Drive | $1,258,000 | $1,260,000 | 6 | 3 | 2|0 | 1,166 | 65 |
| 2365 Fatjo Place | $1,356,588 | $1,255,000 | 25 | 4 | 2|0 | 1,630 | 70 |
| 2636 Glade Drive | $1,269,999 | $1,230,000 | 45 | 3 | 2|0 | 942 | 65 |
| 2185 Menzel Place | $1,099,000 | $1,207,000 | 5 | 3 | 2|0 | 1,181 | 66 |
| 2040 Benton Street | $1,195,000 | $1,150,000 | 35 | 3 | 1|0 | 1,036 | 70 |
| 2985 Fresno Street | $1,100,000 | $1,125,000 | 0 | 2 | 1|0 | 1,064 | 73 |
| 2532 Rose Way | $1,150,000 | $1,075,000 | 31 | 3 | 2|0 | 1,166 | 65 |
| 661 Park Court | $950,000 | $1,060,000 | 5 | ||||
| 4646 Armour Drive | $1,060,000 | $1,060,000 | 9 | 3 | 2|0 | 1,242 | 60 |
Contact Me Today
Have a question? Interested in setting an appointment to talk about your real estate plans? Contact me today.
-
VINICIUS BRASIL, Realtor
Keller Williams - The Brasil Group
19400 Stevens Creek Blvd #200
Cupertino, CA 95014 - 408.582.3272
- Schedule a meeting
Santa Clara Housing Market Archive
July 2020 home sales CLICK HERE.
June 2020 home sales CLICK HERE.
May 2020 home sales CLICK HERE.
April 2020 home sales CLICK HERE.
March 2020 home sales CLICK HERE.
January 2020 home sales CLICK HERE.
December 2019 home sales CLICK HERE.
November 2019 home sales CLICK HERE.
October 2019 home sales CLICK HERE.
September 2019 home sales CLICK HERE.
August 2019 home sales CLICK HERE.
July 2019 home sales CLICK HERE.
June 2019 home sales CLICK HERE.
May 2019 home sales CLICK HERE.
April 2019 home sales CLICK HERE.
March 2019 home sales CLICK HERE.
February 2019 home sales CLICK HERE.
January 2019 home sales CLICK HERE.
December 2018 home sales CLICK HERE.
November 2018 home sales CLICK HERE.
October 2018 home sales CLICK HERE.
September 2018 home sales CLICK HERE.
August 2018 home sales CLICK HERE.
July 2018 home sales CLICK HERE.
June 2018 home sales CLICK HERE.
May 2018 home sales CLICK HERE.
