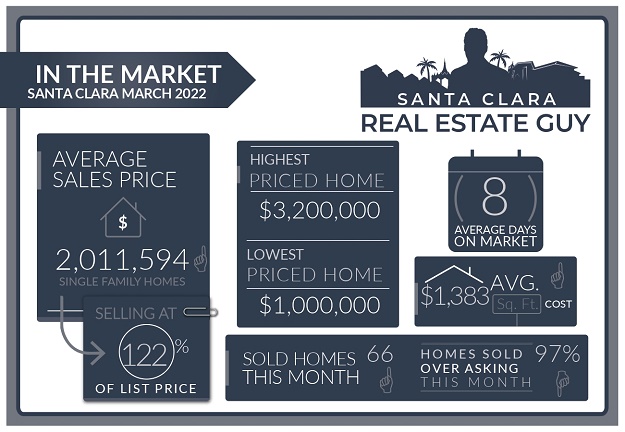
The Santa Clara housing market in March experienced 66 single-family homes that closed escrow, which is 28 more than closed escrow in the previous month of February.
The average price of a home sold in March was $2.01M which is about $118K higher than last month’s figure of $1.89M. The median price home sold was $1.96M, about $54K higher than the median price in February.
The average cost per square foot saw an increase from $1331 per Sq. Ft. to $1383 per Sq. Ft. All of the 66 homes sold in March, 64 sold over the list price.
On average homes that sold did so at 22.41% over asking compared to 20.96% over asking in the previous month.
We started the month of March with 35 active single-family home listings and finished with 26 active single-family homes for sale in all of Santa Clara.
Inventory of Homes for Sale Remains Low
Its still a strong seller’s market in Santa Clara but showing signs of weakening.
Low inventory continues to be a problem for home shoppers. I am noticing two important details that show the market slowing.
1) We are receiving less offers on homes.
2) Homes seem to be staying on the market a bit longer.
Currently, there are around 25-30 single family homes on the market in all of Santa Clara, and a similar number of condos and townhomes.
Altos Research Market Data For Santa Clara
High Home Values
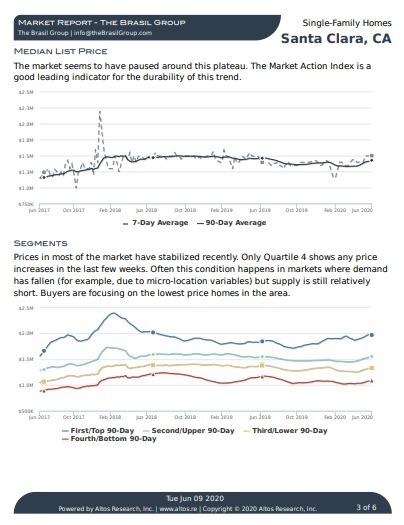
Home values are at record highs, and buyers are proceeding cautiously. High home values have likely priced some buyers out of the market entirely or cause some buyers to pursue a wait and see attitude regarding their home purchase.
Homes in great locations and good neighborhoods as well as updated homes are still selling quite well.
I am noticing that some homes are staying on the market for more than 2 weeks prior to accepting an offer.
There are also several properties that have been languishing on the market. These tend to be less desirable homes in poor locations or areas, or homes that are not priced accurately.
Santa Clara Market Reports
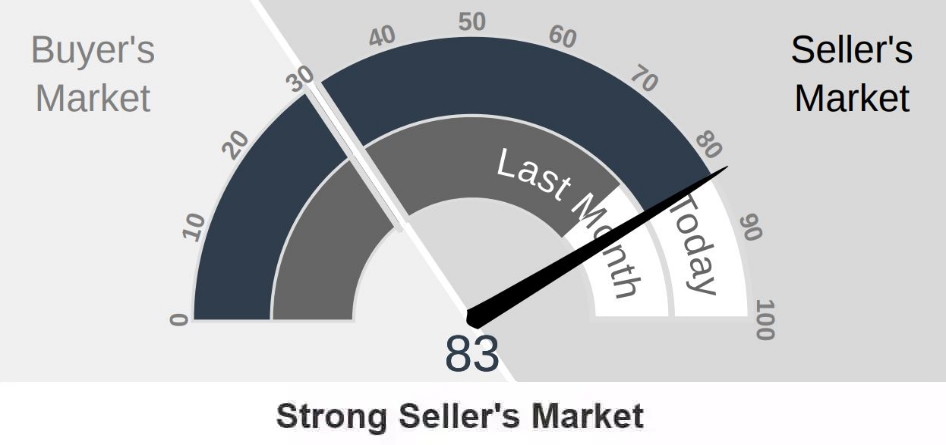
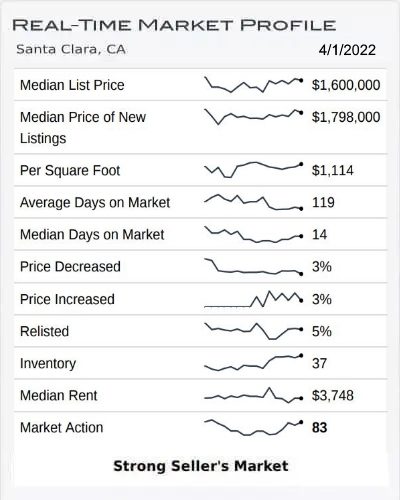
The Altos Research Market Action Index for single-family homes in Santa Clara has increased to 83 from 73 where it was last month. For more detailed reports on Santa Clara and Santa Clara Zip codes, you can access the reports here.
Santa Clara Report
95051 Report
95050 Report
95054 Report
Seasonal Trends:
We are well into the Spring market and inventory has stayed relatively the same level as we saw at the end of January.
The rate of buyer activity has been absorbing many of the new listings causing the market to stay strong for sellers.
Generally the rate new listings will surpass demand and slow the market. That has yet to happen this year.
Other Factors in the Market:
Mortgage rates continue to inch higher.
The stock market has rebounded off of lows for the year, but seems to be in a holding pattern.
As interest rates increase I suspect buying activity will slow and inventory will start to climb. We may be staring to see the beginning of that pattern developing right now, but its too soon to tell.
Save thousands when you sell.
Includes Free Staging and Our Complete Selling Solution
* Total commission 4% including buyer side agent commission of 2.5%, offer varies by value of home.
What Can We Expect Moving Forward?
Buyers, if you are trying to buy a home right now you are likely to be facing some competition but not as much as there was a month ago.
It seems that all the factors are lining up for a slow down in the coming months, but hard to say. The buying activity has been so strong this year that inventory has yet to increase.
Proceeding with caution may be a smart move. Understand that highly sought after homes in good areas, are always going to get lots of attention.
Continue to monitor inventory levels and days on market for homes. If the market does slow down, I wouldn’t expect it to correct much. There is a chance homebuyers in June may get better deals than Aprils home buyers.
Sellers, that market is still strong right now for home sellers, but slowing. That means less offers and if you don’t strategize your home sale correctly you could get stuck in a slowing or dropping market.
As always it’s important to understand how your home relates in this market, not all homes are getting the same level of attention.
Therefore understand where your home fits in this market and price it to sell. You don’t want your home sitting on the market if a correction hits.
Conclusion:
As always, whether you are buying or selling, understanding the current market and how your home relates will set you up for success. The housing stock of Santa Clara is very diverse and can vary greatly from one neighborhood to the next.
Developing the right strategy for your home will maximize your ability to sell for top value.
If you have any questions about a home on the market or your home’s value, please feel free to reach out, I am happy to hear from you.
Contact Me Today
Have a question? Interested in setting an appointment to talk about your real estate plans? Contact me today.
-
VINICIUS BRASIL, Realtor
Keller Williams - The Brasil Group
19400 Stevens Creek Blvd #200
Cupertino, CA 95014 - 408.582.3272
- Schedule a meeting

Message Me Directly:
Santa Clara March 2022 Home Sales
| Street Address | List Price | Price | DOM | Beds Total | Bths | Sq Ft Total | Age |
| 1154 Inverness Avenue | $2,888,000 | $3,200,000 | 5 | 5 | 3|0 | 3,643 | 71 |
| 136 Rodonovan Drive | $2,950,000 | $3,100,000 | 5 | 4 | 3|0 | 2,070 | 68 |
| 548 Hubbard Avenue | $2,295,000 | $3,051,000 | 6 | 4 | 2|0 | 1,794 | 63 |
| 152 Blake Avenue | $1,988,000 | $2,868,000 | 6 | 3 | 2|0 | 1,347 | 67 |
| 317 Montclair Drive | $2,499,000 | $2,850,000 | 0 | 4 | 3|0 | 1,740 | 65 |
| 1871 Saint Lawrence Drive | $1,989,000 | $2,715,000 | 9 | 3 | 3|0 | 1,548 | 68 |
| 2810 Pruneridge Avenue | $2,098,000 | $2,480,000 | 6 | 4 | 2|0 | 1,785 | 47 |
| 3645 De Soto Avenue | $1,688,888 | $2,450,000 | 9 | 3 | 2|0 | 1,684 | 62 |
| 2533 Amethyst Drive | $1,850,000 | $2,450,000 | 11 | 5 | 3|1 | 2,638 | 68 |
| 3552 Dominican Dr | $1,688,000 | $2,401,000 | 3 | 3 | 2|0 | 1,513 | 62 |
| 3094 Via Siena Place | $1,998,000 | $2,400,000 | 5 | 3 | 2|1 | 1,762 | 7 |
| 2370 Cabrillo Avenue | $1,699,999 | $2,385,000 | 7 | 3 | 3|0 | 1,861 | 70 |
| 741 Enright Avenue | $1,888,000 | $2,350,000 | 9 | 3 | 3|0 | 1,635 | 72 |
| 731 San Miguel Avenue | $1,950,000 | $2,300,000 | 6 | 4 | 3|0 | 1,825 | 68 |
| 3149 Barkley Avenue | $1,490,000 | $2,280,000 | 7 | 3 | 2|0 | 1,510 | 65 |
| 2547 Marchese Way | $1,698,000 | $2,255,000 | 7 | 4 | 2|0 | 1,971 | 62 |
| 2985 Warburton Avenue | $1,899,000 | $2,240,000 | 6 | 4 | 3|1 | 1,991 | 66 |
| 336 Concannon Court | $1,598,000 | $2,200,000 | 7 | 3 | 2|1 | 1,338 | 70 |
| 4386 Laird Cir | $1,850,000 | $2,200,000 | 7 | 3 | 2|1 | 2,036 | 17 |
| 756 Armanini Avenue | $1,598,000 | $2,165,000 | 7 | 3 | 2|0 | 1,326 | 72 |
| 621 Hilmar Street | $1,699,800 | $2,145,000 | 9 | 3 | 2|0 | 1,788 | 87 |
| 628 Robin Drive | $1,498,000 | $2,130,000 | 9 | 3 | 2|0 | 1,361 | 71 |
| 3552 Mauricia Avenue | $1,298,000 | $2,105,000 | 8 | 3 | 1|1 | 1,064 | 63 |
| 4110 Tobin Circle | $1,850,000 | $2,100,000 | 7 | 3 | 2|1 | 2,036 | 20 |
| 671 Fairlane Avenue | $1,888,000 | $2,100,000 | 10 | 4 | 2|1 | 1,684 | 62 |
| 2415 Crystal Drive | $1,498,000 | $2,096,000 | 6 | 3 | 2|0 | 1,267 | 67 |
| 2572 Patricia Drive | $1,590,000 | $2,050,000 | 10 | 3 | 2|1 | 1,753 | 67 |
| 961 Maryann Drive | $1,599,000 | $2,048,000 | 8 | 4 | 2|0 | 1,511 | 69 |
| 943 Las Palmas Drive | $1,498,000 | $2,015,000 | 20 | 3 | 2|0 | 1,166 | 67 |
| 2131 Bowers Avenue | $1,498,000 | $2,007,000 | 8 | 3 | 2|0 | 1,315 | 63 |
| 972 Fairfield Ave | $1,675,000 | $2,000,000 | 6 | 3 | 1|1 | 1,495 | 66 |
| 1092 Sunlite Drive | $1,558,000 | $1,970,000 | 6 | 3 | 2|0 | 1,543 | 72 |
| 1750 Briarwood Drive | $1,495,000 | $1,965,000 | 8 | 3 | 2|0 | 1,212 | 68 |
| 643 Scott Boulevard | $1,799,000 | $1,951,285 | 21 | 4 | 4|0 | 2,160 | 75 |
| 4146 Tobin Circle | $1,550,000 | $1,920,000 | 7 | 3 | 3|0 | 1,590 | 20 |
| 3490 Notre Dame Drive | $1,699,950 | $1,918,000 | 7 | 4 | 2|0 | 1,520 | 65 |
| 3443 Flora Vista Avenue | $1,598,888 | $1,905,000 | 5 | 3 | 2|0 | 1,368 | 68 |
| 393 La Salle Avenue | $1,898,000 | $1,905,000 | 22 | 3 | 2|0 | 1,284 | 65 |
| 3454 Flora Vista Avenue | $1,248,000 | $1,851,000 | 6 | 3 | 1|0 | 1,068 | 68 |
| 2022 Staats Way | $1,449,000 | $1,850,000 | 7 | 4 | 2|0 | 1,248 | 61 |
| 4918 Avenida De Los Arboles | $1,699,000 | $1,850,000 | 4 | 4 | 3|0 | 1,850 | 46 |
| 1905 Woodland Avenue | $1,699,000 | $1,850,000 | 4 | 3 | 2|0 | 1,300 | 67 |
| 632 Woodhams Road | $1,588,888 | $1,840,000 | 16 | 4 | 2|0 | 1,367 | 69 |
| 2215 Ventura Place | $1,408,000 | $1,830,000 | 7 | 3 | 2|0 | 1,078 | 67 |
| 1742 Jackson Street | $1,800,000 | $1,820,000 | 7 | 3 | 2|0 | 1,432 | 122 |
| 2111 Rockhurst Court | $1,691,000 | $1,800,000 | 0 | 3 | 2|0 | 1,425 | 64 |
| 1681 Nelson Drive | $1,390,000 | $1,770,000 | 8 | 5 | 3|0 | 1,815 | 62 |
| 453 Juanita Drive | $1,275,000 | $1,730,000 | 10 | 3 | 1|0 | 1,075 | 70 |
| 1776 Laine Avenue | $1,399,000 | $1,730,000 | 8 | 3 | 2|0 | 1,146 | 70 |
| 2454 Forbes Avenue | $1,599,000 | $1,730,000 | 6 | 3 | 2|0 | 1,340 | 65 |
| 1755 Oswald Place | $1,499,000 | $1,720,000 | 7 | 3 | 1|0 | 1,038 | 69 |
| 804 Pepper Tree Lane | $1,800,000 | $1,720,000 | 3 | 2|0 | 2,092 | 66 | |
| 197 N Cypress Avenue | $1,499,950 | $1,700,000 | 9 | 3 | 2|0 | 1,141 | 67 |
| 1685 Betty Court | $1,588,000 | $1,700,000 | 7 | 3 | 2|0 | 1,433 | 64 |
| 1855 De La Pena Avenue | $1,288,600 | $1,680,000 | 7 | 2 | 1|0 | 1,012 | 0 |
| 617 Kiely Boulevard | $1,599,000 | $1,620,000 | 16 | 3 | 2|0 | 1,254 | 67 |
| 1820 Briarwood Drive | $1,195,000 | $1,600,000 | 0 | 3 | 1|0 | 1,097 | 68 |
| 793 Park Court | $1,359,000 | $1,600,000 | 5 | 4 | 2|0 | 1,357 | 98 |
| 2516 Parkland Court | $1,388,000 | $1,588,888 | 14 | 3 | 2|0 | 897 | 0 |
| 1545 Lexington Street | $1,399,000 | $1,550,000 | 6 | 3 | 2|0 | 1,180 | 107 |
| 2527 Pilot Knob Drive | $1,328,888 | $1,500,000 | 13 | 3 | 1|0 | 897 | 68 |
| 1816 Park Vista Circle | $1,290,000 | $1,430,000 | 5 | 3 | 2|0 | 1,538 | 33 |
| 621 Park Court | $1,199,000 | $1,405,000 | 7 | 2 | 2|0 | 1,265 | 98 |
| 2084 Sheraton Drive | $1,350,000 | $1,350,000 | 2 | 3 | 1|0 | 1,020 | 61 |
| 1895 Washington Street | $1,150,000 | $1,280,000 | 6 | 2 | 1|0 | 945 | 77 |
| 1031 Di Giulio Avenue | $975,000 | $1,000,000 | 18 | 3 | 1|0 | 937 | 87 |
Santa Clara Housing Market Archive
March 2022 home sales CLICK HERE.
February 2022 home sales CLICK HERE.
December 2021 home sales CLICK HERE.
November 2021 home sales CLICK HERE.
October 2021 home sales CLICK HERE.
September 2021 home sales CLICK HERE.
July 2021 home sales CLICK HERE.
May 2021 home sales CLICK HERE.
April 2021 home sales CLICK HERE.
March 2021 home sales CLICK HERE.
February 2021 home sales CLICK HERE.
January 2021 home sales CLICK HERE.
November 2020 home sales CLICK HERE.
October 2020 home sales CLICK HERE.
September 2020 home sales CLICK HERE.
August 2020 home sales CLICK HERE.
July 2020 home sales CLICK HERE.
June 2020 home sales CLICK HERE.
May 2020 home sales CLICK HERE.
April 2020 home sales CLICK HERE.
March 2020 home sales CLICK HERE.
January 2020 home sales CLICK HERE.
