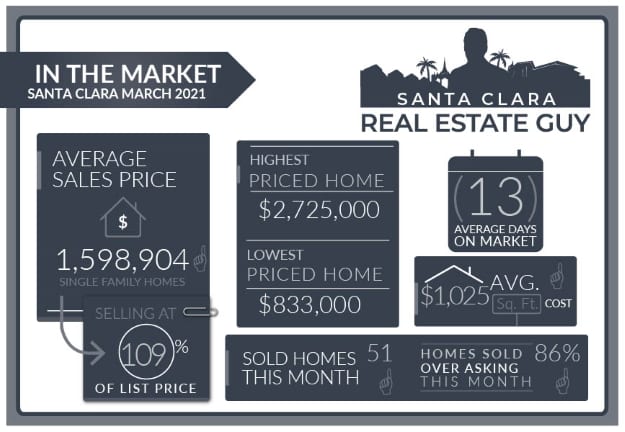
The Santa Clara housing market in March experienced 51 single-family homes that closed escrow, which is 15 more than closed escrow in the previous month of February.
The average price of a home sold in March was $1.6M which is about $60K Higher than last month’s figure of $1.54M. The median price home sold was $1.55M, which is about $30K higher than February’s median price.
The average cost per square foot had a slight increase from $974 per Sq. Ft. to $1025. Of the 51 homes sold in March, 44 sold over the list price.
On average homes that sold, sold 9.64% over asking compared to 6.33% over asking in the previous month.
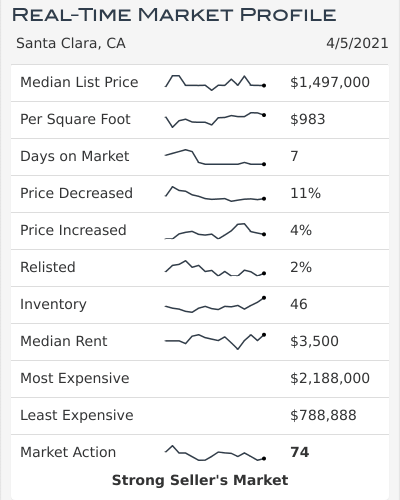
We started the month of March with 29 active single-family home listings and finished with 15 single family homes for sale in all of Santa Clara.
The market continues to experience multiple offers and homes are selling quickly. Generally this time of year we see the inventory of homes for sale increasing. Buyers up until now have been able to absorb new inventory and as a result inventory levels have remained pretty much the same as they were at the beginning of the month.
April marks the beginning of the Prop 19 period where homeowners can buy and sell, and transfer their existing property tax basis to a new home anywhere in California. This was designed to help motivate homeowners to move, and lead to more home sales.
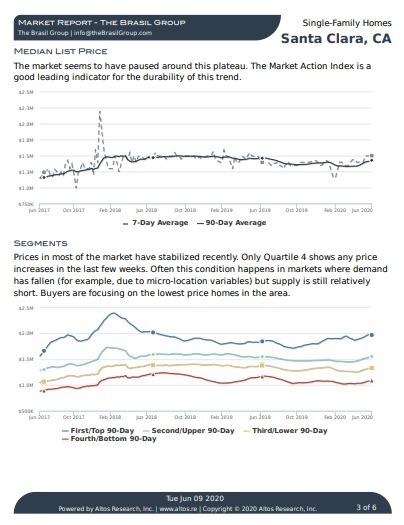
Altos Research Market Data For Santa Clara
COVID numbers are falling. Some feel that this will result in more home owners to put their home’s on the market, resulting in an increase of home inventory.
There have been areas of the valley such as in South San Jose where inventory has noticeably increased about 20% in the last month.
Santa Clara’s available rose in March but has since contracted to early March levels.
As we move further into the Spring inventory should increase. The longer inventory levels stay tight the stronger home values will remain.
Santa Clara Market Reports
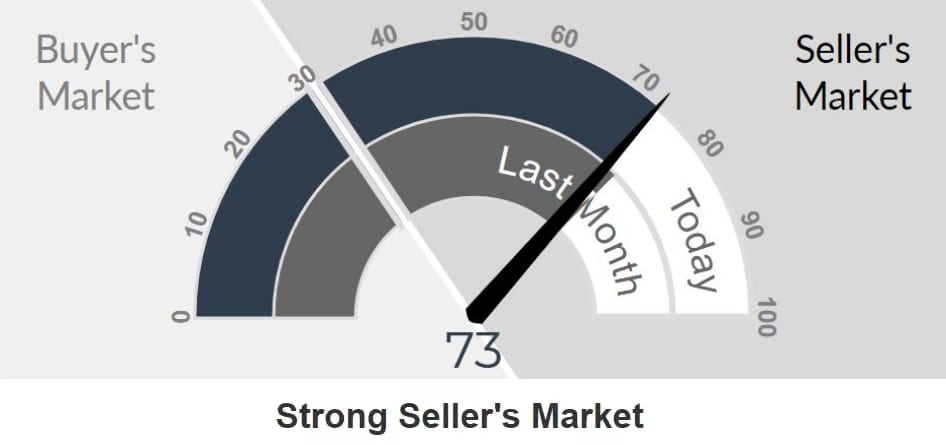
The Altos Research Market Action Index for single-family homes in Santa Clara has decreased to 73 from 75 where it was last month. For more detailed reports on Santa Clara and Santa Clara Zip codes, you can access the reports here.
Santa Clara Report
95051 Report
95050 Report
95054 Report
As COVID numbers drop interest rates will trend upwards. In the last few weeks, interest rates on 30-year mortgages have been steadily increasing and are roughly up 20 basis points from the beginning of March.
Higher interest rates will impact a buyer’s ability to qualify for a higher loan. As interest rates increase there will be more downward pressure on the stock market in anticipation of a slowing economy. This will have a double effect on affordability for bay area housing.
With interest rates increasing steadily, the stock market in a holding pattern, and higher home values, affordability is not getting much better for local home buyers.
In these tight, fast appreciating markets, some home buyers will drop out of the market due to being priced out or just fatigued by the process.
Once home inventory increases this will likely mean a more favorable market for buyers, and may even result in a pullback on home prices.
Inventory for town homes and condos has also remained pretty steady in the last month. As home buyers get priced out of single-family homes some will turn to townhomes and we have seen some townhome markets in Sunnyvale and parts of Santa Clara performing much better in recent weeks.
Save thousands when you sell.
Includes Free Staging and Our Complete Selling Solution
* Total commission 4% including buyer side agent commission of 2.5%, offer varies by value of home.
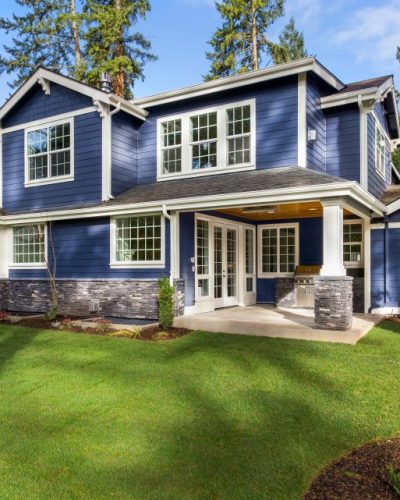
For the remainder of the month of April and May, what can we expect?
Buyers, if you haven’t dropped out of the market yet due to the steep price increases, you may want to start playing it a little safe. Now keep in mind that real estate in Santa Clara or any area is not general. If you a looking for a specific type of home or desirable neighborhood where these listings do not come up frequently, then it will always be a challenge to buy in any market.
Buyers who are in the market for standard 3 or 4 bedroom homes in average Santa Clara neighborhoods this is the market that will be impacted once inventory levels start to increase.
Stay focused and keep shopping, I would expect there to be more opportunities in the next few weeks.
Sellers, you really could not ask for a better market to be listing your home in. The question moving forward is where will prices be in a few months.
Well, I think there is a very strong chance that this market will stall in Summer. As the market typically does.
With that said, if you are selling you really should start the process. Understand what you need to do to get your home ready, how much time that will take, and have a plan for when you expect to have your home on the market.
As always, whether you are buying or selling, be sure to understand how your home or the property you are considering ranks in the current market. Understanding the Santa Clara housing market is important when determining the right price and solid home investment.
If you have any questions about a home on the market or your home’s value, please feel free to reach out, I am happy to hear from you.
Contact Me Today
Have a question? Interested in setting an appointment to talk about your real estate plans? Contact me today.
-
VINICIUS BRASIL, Realtor
Keller Williams - The Brasil Group
19400 Stevens Creek Blvd #200
Cupertino, CA 95014 - 408.582.3272
- Schedule a meeting

Santa Clara March 2021 Home Sales
| Street Address | List Price | Price | DOM | Beds Total | Bths | Sq Ft Total | Age |
| 464 Muriel Court | $2,649,000 | $2,725,000 | 4 | 6 | 3|1 | 3,845 | 61 |
| 3751 Redtail Court | $2,299,950 | $2,230,000 | 11 | 4 | 2|1 | 2,653 | 28 |
| 1034 Bluebird Avenue | $1,688,000 | $2,215,000 | 12 | 4 | 2|0 | 1,480 | 60 |
| 3081 Toomey Place | $2,195,000 | $2,165,000 | 186 | 4 | 4|1 | 2,990 | 0 |
| 1963 Harrison Street | $1,699,950 | $1,980,000 | 6 | 4 | 3|0 | 1,686 | 73 |
| 3492 Toomey Place, #59 | $1,995,000 | $1,950,000 | 0 | 3 | 3|2 | 2,462 | 1 |
| 1356 Main Street | $1,898,000 | $1,930,000 | 17 | 4 | 3|0 | 2,500 | 95 |
| 3041 Pruneridge Avenue | $1,790,000 | $1,925,000 | 14 | 4 | 3|1 | 1,842 | 58 |
| 2151 Bowers Avenue | $1,698,888 | $1,870,000 | 8 | 4 | 3|0 | 1,935 | 62 |
| 694 Valley Way | $1,625,000 | $1,825,000 | 8 | 3 | 2|1 | 1,684 | 61 |
| 2302 Cherrystone Drive | $1,850,000 | $1,825,000 | 31 | 4 | 2|0 | 2,004 | 71 |
| 3310 Princeton Way | $1,649,888 | $1,822,000 | 8 | 3 | 2|0 | 1,442 | 60 |
| 1011 Live Oak Drive | $1,698,000 | $1,800,000 | 1 | 4 | 2|1 | 1,700 | 58 |
| 2159 Laurel Drive | $1,399,000 | $1,800,000 | 8 | 3 | 2|0 | 1,534 | 70 |
| 3419 Creighton Place | $1,599,000 | $1,775,000 | 7 | 3 | 2|0 | 1,462 | 66 |
| 2341 Esperanca Avenue | $1,699,888 | $1,770,000 | 11 | 5 | 3|0 | 2,326 | 23 |
| 680 Nicholson Avenue | $1,499,800 | $1,760,000 | 8 | 3 | 2|0 | 1,326 | 66 |
| 3108 Butte Street | $1,520,000 | $1,751,000 | 12 | 3 | 3|0 | 1,679 | 73 |
| 2056 Clark Avenue | $1,398,000 | $1,750,000 | 6 | 3 | 2|0 | 1,207 | 62 |
| 382 Hayes Avenue | $1,499,888 | $1,734,000 | 7 | 3 | 2|0 | 1,260 | 66 |
| 2867 Butte Street | $1,588,000 | $1,700,000 | 15 | 3 | 2|0 | 1,595 | 74 |
| 82 Rousseau Place | $1,698,000 | $1,700,000 | 0 | 4 | 3|1 | 2,166 | 7 |
| 1980 Santa Inez Court | $1,499,900 | $1,680,000 | 0 | 3 | 2|0 | 1,303 | 67 |
| 2823 Toledo Avenue | $1,600,000 | $1,570,000 | 6 | 3 | 2|0 | 1,626 | 61 |
| 4621 Cheeney Street | $1,388,000 | $1,565,000 | 47 | 3 | 2|1 | 1,667 | 23 |
| 1555 Farmer Place | $1,448,000 | $1,552,000 | 5 | 4 | 3|1 | 1,993 | 12 |
| 641 N Henry Avenue | $1,398,000 | $1,550,000 | 1 | 3 | 2|0 | 1,382 | 66 |
| 712 Jefferson Street | $1,400,000 | $1,550,000 | 6 | 3 | 2|0 | 2,475 | 114 |
| 750 Robin Drive | $1,325,000 | $1,550,000 | 7 | 3 | 2|0 | 1,240 | 71 |
| 4217 Verdigris Circle | $1,468,000 | $1,531,000 | 7 | 3 | 2|1 | 1,417 | 25 |
| 2124 Warburton Avenue | $1,295,000 | $1,505,000 | 0 | 4 | 2|0 | 1,303 | 70 |
| 1335 Crowley Avenue | $1,188,000 | $1,490,000 | 7 | 3 | 2|0 | 1,227 | 65 |
| 325 Los Padres Boulevard | $1,299,000 | $1,460,000 | 11 | 3 | 1|0 | 1,387 | 68 |
| 1194 N Monroe Street | $1,350,000 | $1,460,000 | 8 | 4 | 3|0 | 2,342 | 31 |
| 2338 Menzel Place | $1,350,000 | $1,420,000 | 0 | 3 | 2|0 | 1,485 | 67 |
| 2621 Monroe Street | $1,248,000 | $1,401,111 | 3 | 3 | 2|0 | 1,064 | 62 |
| 3652 Beth Court | $1,099,000 | $1,365,000 | 13 | 3 | 2|0 | 1,097 | 59 |
| 747 Kiely Boulevard | $1,299,950 | $1,360,000 | 6 | 3 | 2|0 | 1,254 | 66 |
| 1972 Bowers Avenue | $1,339,000 | $1,335,000 | 14 | 4 | 2|0 | 1,158 | 61 |
| 845 Fremont Street | $1,295,000 | $1,330,000 | 11 | 3 | 1|0 | 1,188 | 70 |
| 744 Lewis Street | $1,199,000 | $1,320,000 | 13 | 4 | 3|0 | 1,691 | 131 |
| 3227 Fowler Avenue | $1,300,000 | $1,300,000 | 25 | 3 | 1|0 | 1,284 | 67 |
| 1151 Kiely Boulevard | $1,099,888 | $1,300,000 | 16 | 3 | 2|0 | 1,167 | 66 |
| 916 Tamarack Avenue | $1,075,000 | $1,225,000 | 7 | 3 | 2|0 | 1,376 | 71 |
| 2870 Monroe Street | $999,000 | $1,210,000 | 4 | 4 | 2|0 | 1,403 | 63 |
| 1183 Campbell Avenue | $1,188,000 | $1,210,000 | 7 | 3 | 2|1 | 1,371 | 12 |
| 2516 Glade Drive | $999,000 | $1,165,000 | 10 | 3 | 1|0 | 897 | 67 |
| 2244 Newhall Street | $1,149,000 | $1,150,000 | 10 | 3 | 1|0 | 1,092 | 73 |
| 2314 Park Avenue | $1,118,888 | $1,135,000 | 13 | 3 | 2|1 | 1,622 | 45 |
| 4673 Mangrum Drive | $1,000,000 | $1,020,000 | 12 | 3 | 2|0 | 1,095 | 61 |
| 3511 Pitcairn | $775,000 | $833,000 | 4 | 3 | 2|0 | 1,110 | 0 |
Santa Clara Housing Market Archive
March 2021 home sales CLICK HERE.
February 2021 home sales CLICK HERE.
January 2021 home sales CLICK HERE.
December 2020 home sales CLICK HERE.
November 2020 home sales CLICK HERE.
October 2020 home sales CLICK HERE.
September 2020 home sales CLICK HERE.
August 2020 home sales CLICK HERE.
July 2020 home sales CLICK HERE.
June 2020 home sales CLICK HERE.
May 2020 home sales CLICK HERE.
April 2020 home sales CLICK HERE.
March 2020 home sales CLICK HERE.
January 2020 home sales CLICK HERE.
