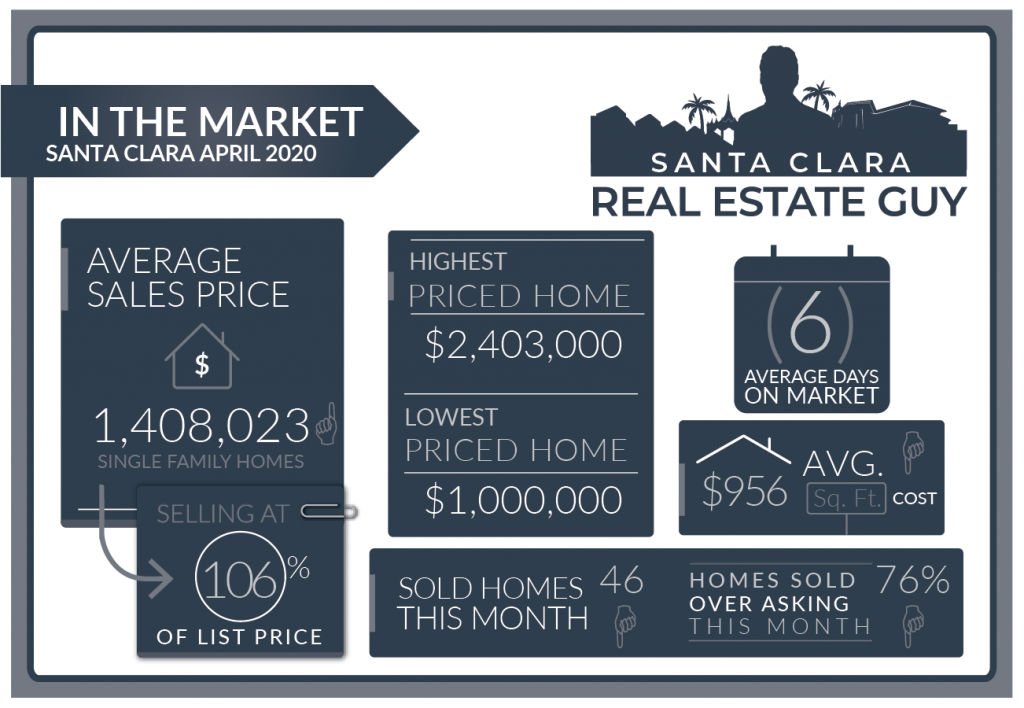
Here is a recap of the Santa Clara housing market in April. There were 46 single-family homes that closed escrow in April, which was slightly less than the 50 which sold in March. The average days on market of those homes sold went to 6 days from 11 days the previous month, and median days decreased to 5 from 7. (The MLS suspended its tracking of days on Market so this metric is not accurate)
The average price of a home sold in April 2020 was $1.41M which is about $70K higher than last month’s figure of $1.34M. The Median price home sold was $1.425M, which is about $45K higher than March’s median price. (This is more likely an indication of higher value homes selling and not prices increasing. See below as the price per square foot decrease indicating larger homes selling versus smaller homes.)
The average cost per square foot decreased from $1,018 per Sq. Ft. to $956. Of the 46 homes sold in March, 46 sold over asking. On average homes sold 6% over asking compared to 11.2% over asking in the previous month.
We started the month of April with just 25 active listings and finished with 40 in all of Santa Clara.

Our second month of Sheltering in Place contributed to a very slow real estate market. There were 50 home listed last month, compared with 66 in April of 2019. April has been a pivotal month in the last few years. We have seen markets change in April as inventory begins to outpace buying activity.
Of those 50 homes, only 24 have accepted contracts or sold and 4 were taken off the market.
Although inventory climbed in April from 25 in March to 40 homes, seasonally we are below typical inventory levels for May. In spite of the low inventory levels home sales are slow and that is due to soft buyer demand and activity.
I generally argue that its inventory that drives the market. With only 40 homes on the market I would be expecting multiple offers and home values to be appreciating. In our current market home values are holding steady and multiple offers are almost non existent.
Santa Clara Market Reports
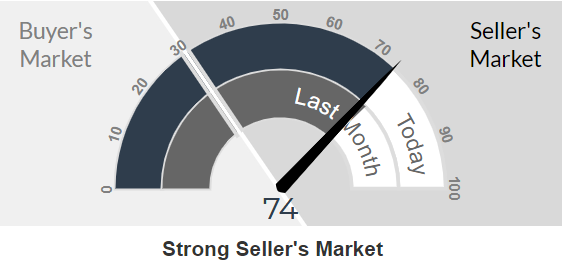
The Altos Research Market Action Index for single-family homes in Santa Clara has slightly decreased to 74 from 75 where it was last month. For more detailed reports on Santa Clara and Santa Clara Zip codes, you can access the reports here.
Santa Clara Report
95051 Report
95050 Report
95054 Report
Overall the market is very stable, pricing is holding up and not dropping even though home sales and buyer demand is weak.
Just this last week I noticed an uptick in buyer activity with showings and pending sales. Perhaps buyers are realizing that prices are not going to fall as much as they may have anticipated, and the stock market has remained steady and recovered a bit from its lows.
I have been speculating that as things get back to normal and policies regarding shelter in place are relaxed there would be a flood of new listings coming on the market causing the market to soften. This has not occurred, if anything the market seems to have tightened up since last week.
There were so many sales planned this year that have been put on hold, and many homes listed that were pulled off the market and I assume they will be back.
Buyers, even though prices are remaining firm, that is not to say that sellers are not accepting offers below their listed price. It just indicates to me that the market is not really dropping and the room for negotiation with prices is not as much as you think.
I still think that more inventory will come but perhaps it will be June or later this summer causing prices to ease down a bit more. Not dramatic price drops but steady softening until the fall or early winter.
Sellers, there is a possibility that buyers rush in because of the low rates and relatively low prices and start competing with each other to buy homes. We are seeing a bit of that now on certain select properties, but I don’t really believe in this scenario as much as I think inventory will start to overwhelm the market.
There is just so much happening right now with buyer and seller attitudes that have created a unique market for this time of year, and of course the specific property has much to do with demand.
Santa Clara Home Sales April 2020
| Street Address | List Price | Price | DOM | Beds Total | Bths | Sq Ft Total | Age |
| 2687 Birchtree Lane | $1,999,000 | $2,403,000 | 9 | 3 | 2|1 | 2,183 | 47 |
| 515 Barto Street | $1,825,000 | $1,875,000 | 8 | 3 | 2|0 | 1,826 | 57 |
| 184 Bel Ayre Drive | $1,795,000 | $1,830,777 | 6 | 5 | 3|1 | 2,578 | 69 |
| 3462 Wheeling Drive | $1,680,000 | $1,830,000 | 8 | 3 | 2|0 | 1,728 | 59 |
| 1746 Townsend Avenue | $1,768,000 | $1,808,000 | 7 | 3 | 3|0 | 1,800 | 66 |
| 1179 Scott Boulevard | $1,649,950 | $1,780,000 | 11 | 3 | 3|0 | 1,855 | 72 |
| 103 Kellogg Way | $1,649,000 | $1,775,000 | 2 | 3 | 2|0 | 1,388 | 62 |
| 2127 Santa Cruz Avenue | $1,700,000 | $1,741,888 | 1 | 3 | 2|0 | 1,517 | 65 |
| 3222 Loma Alta Drive | $1,495,000 | $1,700,000 | 4 | 3 | 2|0 | 1,496 | 57 |
| 1016 Teal Drive | $1,649,000 | $1,680,000 | 5 | 3 | 2|0 | 1,388 | 57 |
| 2128 Ventura Place | $1,500,000 | $1,650,000 | 1 | 3 | 2|0 | 1,718 | 65 |
| 1030 Pomeroy Avenue | $1,598,000 | $1,650,000 | 7 | 3 | 2|0 | 1,733 | 55 |
| 891 Harrison Street | $1,675,000 | $1,635,000 | 0 | 3 | 2|0 | 1,978 | 110 |
| 1391 Market Street | $1,620,000 | $1,620,000 | 2 | 3 | 3|0 | 2,160 | 115 |
| 80 Cook Place | $1,680,000 | $1,600,000 | 20 | 4 | 3|1 | 2,166 | 6 |
| 2440 Raggio Avenue | $1,448,000 | $1,580,000 | 3 | 4 | 3|0 | 1,613 | 68 |
| 1667 Berna Street | $1,450,000 | $1,572,000 | 6 | 3 | 3|0 | 2,002 | 83 |
| 220 Calvert Court | $1,399,888 | $1,550,000 | 3 | 3 | 2|0 | 1,118 | 64 |
| 3536 Golden State Drive | $1,500,000 | $1,535,000 | 7 | 3 | 2|0 | 1,468 | 66 |
| 2971 Mark Avenue | $1,450,000 | $1,510,000 | 2 | 3 | 2|0 | 1,457 | 62 |
| 1763 Fremont Street | $1,498,000 | $1,500,000 | 0 | 4 | 3|0 | 2,025 | 9 |
| 3436 Bella Vista Avenue | $1,298,000 | $1,475,000 | 8 | 3 | 2|0 | 1,212 | 66 |
| 141 Bret Harte Court | $1,200,000 | $1,475,000 | 11 | 4 | 2|0 | 1,350 | 65 |
| 671 Park Court | $1,458,000 | $1,458,000 | 17 | 3 | 3|0 | 1,637 | 96 |
| 1735 Ravizza Avenue | $1,400,000 | $1,430,000 | 0 | 3 | 2|0 | 1,283 | 65 |
| 2101 El Capitan Avenue | $1,300,000 | $1,425,000 | 6 | 3 | 2|1 | 1,905 | 59 |
| 3605 Eastwood Circle | $1,345,000 | $1,425,000 | 8 | 4 | 2|0 | 1,565 | 53 |
| 2019 Coolidge Drive | $1,149,000 | $1,415,000 | 8 | 3 | 2|0 | 1,181 | 57 |
| 932 Pomeroy Avenue | $1,449,950 | $1,405,000 | 5 | 4 | 2|0 | 1,845 | 56 |
| 995 Curtis Avenue | $1,298,888 | $1,390,000 | 0 | 3 | 2|0 | 1,166 | 66 |
| 2893 Cabrillo Avenue | $1,428,000 | $1,390,000 | 10 | 4 | 2|1 | 1,910 | 60 |
| 331 Los Padres Boulevard | $1,199,950 | $1,370,000 | 9 | 3 | 1|1 | 1,035 | 67 |
| 2220 Brown Avenue | $1,298,000 | $1,340,000 | 0 | 3 | 2|0 | 1,034 | 62 |
| 986 Elizabeth Drive | $1,199,000 | $1,300,000 | 0 | 4 | 2|0 | 1,484 | 67 |
| 2238 Schott Court | $1,099,800 | $1,290,000 | 1 | 3 | 2|1 | 1,400 | 20 |
| 1271 Moraga Street | $1,050,000 | $1,285,000 | 5 | 3 | 1|0 | 1,060 | 71 |
| 2217 3rd Street | $1,088,000 | $1,275,000 | 3 | 3 | 2|1 | 1,400 | 20 |
| 3035 Warburton Avenue | $1,299,950 | $1,200,000 | 5 | 3 | 2|0 | 1,237 | 63 |
| 643 Park Court | $999,000 | $1,181,000 | 10 | 3 | 1|0 | 1,301 | 96 |
| 2726 Donovan Avenue | $1,199,950 | $1,180,000 | 0 | 3 | 3|1 | 1,578 | 64 |
| 2405 Alvarado Drive | $1,199,950 | $1,170,000 | 12 | 4 | 2|0 | 1,694 | 52 |
| 3858 Willow Way | $1,150,000 | $1,150,000 | 35 | 4 | 3|0 | 2,306 | 55 |
| 451 Bellwood Drive | $1,050,000 | $1,150,000 | 2 | 3 | 2|0 | 1,298 | 55 |
| 962 Sunlite Drive | $1,088,000 | $1,140,000 | 6 | 3 | 2|0 | 1,466 | 71 |
| 3073 Cabrillo Avenue | $995,000 | $1,070,000 | 0 | 3 | 2|0 | 1,078 | 65 |
| 3298 Victoria Avenue | $1,200,000 | $1,000,000 | 5 | 3 | 2|0 | 1,348 | 66 |
Contact Me Today
Have a question? Interested in setting an appointment to talk about your real estate plans? Contact me today.
-
VINICIUS BRASIL, Realtor
Keller Williams - The Brasil Group
19400 Stevens Creek Blvd #200
Cupertino, CA 95014 - 408.582.3272
- Schedule a meeting
Santa Clara Housing Market Archive
April 2020 home sales CLICK HERE.
March 2020 home sales CLICK HERE.
January 2020 home sales CLICK HERE.
December 2019 home sales CLICK HERE.
November 2019 home sales CLICK HERE.
October 2019 home sales CLICK HERE.
September 2019 home sales CLICK HERE.
August 2019 home sales CLICK HERE.
July 2019 home sales CLICK HERE.
June 2019 home sales CLICK HERE.
May 2019 home sales CLICK HERE.
April 2019 home sales CLICK HERE.
March 2019 home sales CLICK HERE.
February 2019 home sales CLICK HERE.
January 2019 home sales CLICK HERE.
December 2018 home sales CLICK HERE.
November 2018 home sales CLICK HERE.
October 2018 home sales CLICK HERE.
September 2018 home sales CLICK HERE.
August 2018 home sales CLICK HERE.
July 2018 home sales CLICK HERE.
June 2018 home sales CLICK HERE.
May 2018 home sales CLICK HERE.


