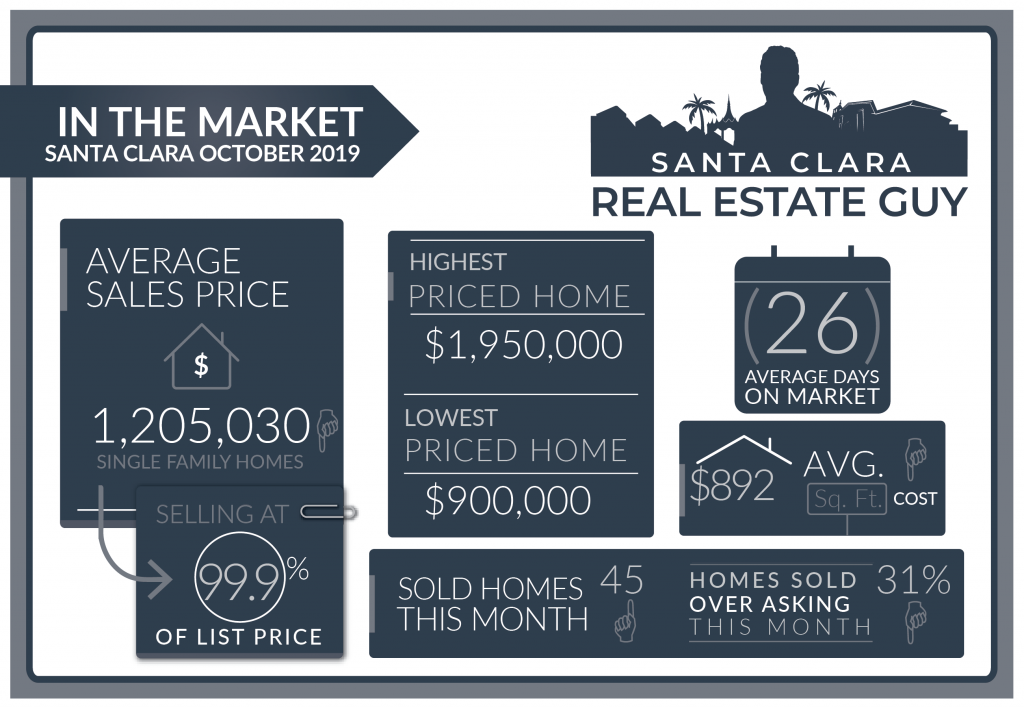
2019 October home sales in Santa Clara consisted of 45 single-family homes that closed escrow, a slight increase from the 44 homes sold in September. Average days on market decreased to 26 days from 34 days, and median days decreased to 16 from 17. The average price of a home sold in October 2019 was $1.2M which is about $40K lower than last month’s figure of $1.24M.
The Median price home sold was $1.2M, which is about $40K lower than September’s median price. The average cost per square foot decreased from $912 per sqft. to $892. Of the 45 homes sold in October, 14 sold over asking. On average homes sold -0.1% under asking compared to -1% under asking in the previous month.
We started the month of October with 45 active listings and finished with 40 active listings. There were 53 new listings that came on in October, and 56 homes that entered into contract.
We are experiencing an interesting market. Inventory has dropped and sales have dropped, interest rates are also very low, but prices continue to settle lower. Our current market is demonstrating that buyers are being very patient in their home-buying decisions, and motivated sellers are dropping their prices to entice o
As we enter into the holiday season the seasonal shift of fewer homes coming on the market. When home inventory drops in our market we start to see homes selling faster and home prices increasing as the instances of multiple offers on homes become more frequent. This coupled with lower interest rates is positioning the market to go up in the next few months.
Not all buyers may not yet be adjusting to this, after all, they have been hearing from their agents and news outlets that the market has been dropping. So buyer attitudes may be that they don’t feel rushed and are still being picky about their home purchase.
We are noticing homes selling faster now, not all homes, but desirable homes that are priced right are getting most if not all the attention. Meanwhile, other homes may be sitting on the market. While this trend of lower inventory continues buyers will start to notice home prices increasing and it may motivate them to buy a home soon.
Keep in mind that the economic situation can be volatile. There are still concerns about the ongoing trade war with China and that situation could escalate and disrupt buyer attitudes.
Santa Clara Home Sales October 2019
| Street Address | List Price | Price | DOM | Beds Total | Bths | Sq Ft Total | Age |
| 1588 &1590 Newhall Street | $2,088,000 | $1,950,000 | 35 | 5 | 4|0 | 2,532 | 0 |
| 3315 Mauricia Avenue | $1,795,000 | $1,880,000 | 9 | 4 | 2|0 | 1,568 | 61 |
| 160 Arcadia Avenue | $1,750,000 | $1,660,000 | 58 | 3 | 2|0 | 1,724 | 61 |
| 1127 Chapel Drive | $1,595,000 | $1,620,000 | 70 | 5 | 3|0 | 2,511 | 71 |
| 3320 Tracy Drive | $1,400,000 | $1,600,000 | 8 | 3 | 2|0 | 1,420 | 62 |
| 3278 Loma Alta Drive | $1,588,000 | $1,578,000 | 11 | 3 | 2|0 | 1,635 | 56 |
| 2295 Alcalde Street | $1,499,800 | $1,470,000 | 26 | 3 | 2|1 | 2,106 | 22 |
| 631 Clara Vista Avenue | $1,499,999 | $1,460,000 | 14 | 3 | 2|1 | 1,641 | 62 |
| 500 Kiely Boulevard | $1,475,000 | $1,435,000 | 61 | 4 | 2|0 | 1,742 | 56 |
| 663 Salberg Avenue | $1,350,000 | $1,425,000 | 9 | 3 | 2|0 | 1,230 | 65 |
| 30 Alviso Street | $1,399,000 | $1,399,000 | 90 | 4 | 3|0 | 1,899 | 73 |
| 2961 Mark Avenue | $1,299,950 | $1,390,000 | 14 | 4 | 2|0 | 1,653 | 61 |
| 472 Clarkwood Court | $1,349,998 | $1,350,000 | 6 | 4 | 2|0 | 1,666 | 50 |
| 956 Pomeroy Avenue | $1,399,950 | $1,350,000 | 59 | 3 | 2|0 | 1,733 | 55 |
| 688 Woodhams Road | $1,348,000 | $1,330,000 | 12 | 3 | 2|0 | 1,368 | 66 |
| 2639 Forbes Avenue | $1,238,000 | $1,300,000 | 6 | 3 | 2|0 | 1,568 | 65 |
| 2129 Avenida De Las Flores | $1,298,000 | $1,298,000 | 39 | 4 | 2|0 | 1,584 | 43 |
| 2743 El Sobrante Street | $1,148,000 | $1,297,500 | 8 | 3 | 2|0 | 1,285 | 63 |
| 185 N Henry Avenue | $1,325,000 | $1,280,000 | 8 | 3 | 2|1 | 1,321 | 67 |
| 1941 Saint Lawrence Drive | $1,189,000 | $1,235,000 | 6 | 3 | 2|0 | 1,212 | 65 |
| 2113 Santa Cruz Avenue | $1,140,888 | $1,235,000 | 7 | 3 | 2|0 | 1,078 | 64 |
| 2815 Rebeiro Avenue | $1,148,000 | $1,228,000 | 3 | 3 | 2|0 | 1,145 | 63 |
| 1263 Carmel Way | $1,275,000 | $1,210,000 | 27 | 3 | 2|0 | 1,129 | 70 |
| 1530 Alviso Street | $1,150,000 | $1,200,000 | 20 | 3 | 2|1 | 1,361 | 0 |
| 2595 Dixon Drive | $1,225,000 | $1,175,000 | 16 | 3 | 2|0 | 1,166 | 64 |
| 1742 Nobili Avenue | $1,198,000 | $1,165,000 | 34 | 3 | 2|0 | 1,458 | 65 |
| 2816 Steinhart Court | $1,200,000 | $1,160,000 | 20 | 3 | 2|0 | 1,245 | 63 |
| 2828 Chromite Drive | $1,199,888 | $1,150,000 | 1 | 3 | 2|0 | 1,468 | 61 |
| 1412 Heatherdale Avenue | $999,000 | $1,125,000 | 9 | 3 | 1|0 | 1,092 | 73 |
| 1891 Bowers Avenue | $1,049,888 | $1,100,000 | 9 | 3 | 2|0 | 1,095 | 61 |
| 2804 Augusta Court | $1,100,000 | $1,100,000 | 11 | 4 | 2|0 | 1,095 | 61 |
| 2094 Sheraton Drive | $1,099,000 | $1,099,000 | 30 | 4 | 2|0 | 1,248 | 58 |
| 1791 Columbus Place | $1,098,000 | $1,050,000 | 6 | 3 | 2|0 | 1,192 | 63 |
| 2801 Cozumel Circle | $1,099,800 | $1,039,000 | 53 | 3 | 2|0 | 1,538 | 30 |
| 2171 Bowers Avenue | $1,050,000 | $1,036,000 | 28 | 3 | 2|0 | 1,008 | 60 |
| 1142 Maryann Drive | $949,000 | $989,000 | 7 | 3 | 1|1 | 1,330 | 65 |
| 656 Flannery Street | $1,100,000 | $950,000 | 33 | 4 | 2|0 | 1,127 | 66 |
| 1284 Fremont Street | $987,888 | $945,000 | 41 | 3 | 2|0 | 1,561 | 95 |
| 1669 Lexington Street | $950,000 | $928,888 | 60 | 1 | 1|0 | 968 | 93 |
| 1674 Main Street | $928,000 | $928,000 | 9 | 2 | 1|0 | 888 | 113 |
| 2636 Glade Drive | $925,000 | $925,000 | 4 | 3 | 2|0 | 942 | 64 |
| 1206 Sherwood Avenue | $988,000 | $900,888 | 17 | 2 | 1|0 | 1,584 | 72 |
| 4606 Armour Drive | $958,000 | $900,000 | 28 | 4 | 2|0 | 1,167 | 59 |
| 4390 Bassett Street | $910,000 | $900,000 | 63 | 3 | 2|0 | 1,246 | 84 |
| 861 Harrison Street | $970,000 | $900,000 | 69 | 3 | 1|0 | 1,053 | 113 |
See Previous Months
September 2019 home sales CLICK HERE.
August 2019 home sales CLICK HERE.
July 2019 home sales CLICK HERE.
June 2019 home sales CLICK HERE.
May 2019 home sales CLICK HERE.
April 2019 home sales CLICK HERE.
March 2019 home sales CLICK HERE.
February 2019 home sales CLICK HERE.
January 2019 home sales CLICK HERE.
December 2018 home sales CLICK HERE.
November 2018 home sales CLICK HERE.
October 2018 home sales CLICK HERE.
September 2018 home sales CLICK HERE.
August 2018 home sales CLICK HERE.
July 2018 home sales CLICK HERE.
June 2018 home sales CLICK HERE.
May 2018 home sales CLICK HERE.
Check out your home’s current value online, quick and free with our new Santa Clara Home Valuation Tool.
http://MySantaClaraHome.com
Get a Detailed Report with all the Sales in your Neighborhood.


