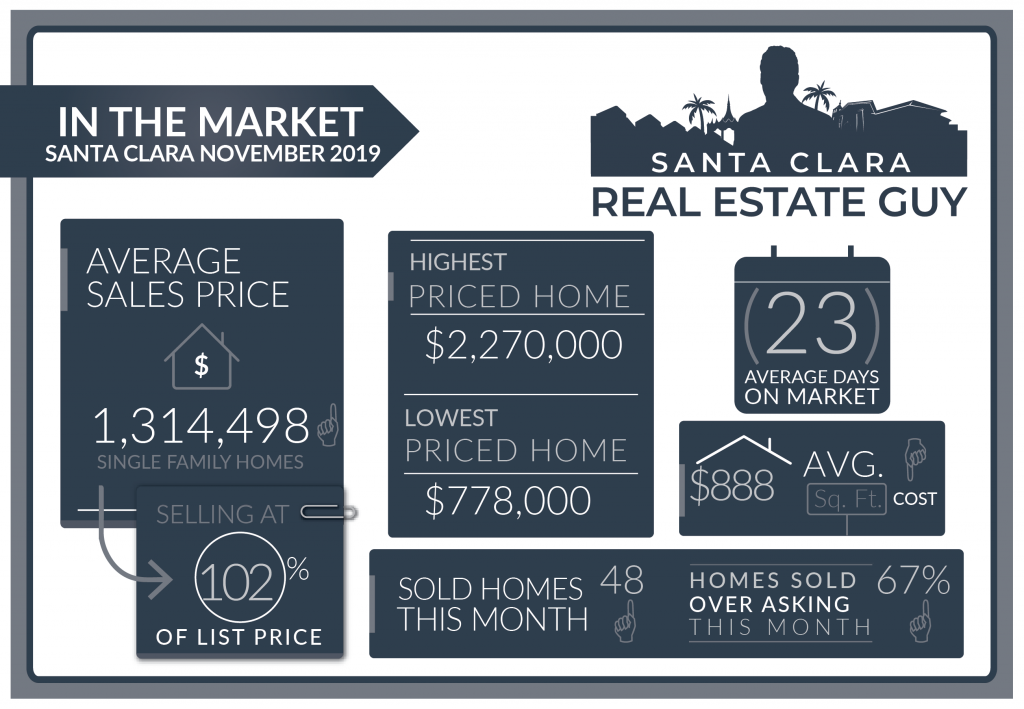
2019 November home sales in Santa Clara consisted of 48 single-family homes that closed escrow, a slight increase from the 45 homes sold in October. Average days on market decreased to 23 days from 26 days, and median days decreased to 10 from 16.
The average price of a home sold in November 2019 was $1.3M which is about $100K higher than last month’s figure of $1.2M. The Median price home sold was $1.35M, which is about $150K higher than October’s median price.
The average cost per square foot decreased from $892 per sqft. to $888. Of the 48 homes sold in November, 30 sold over asking. On average homes sold 2.4% over asking compared to -0.1% under asking in the previous month.
We started the month of November with 40 active listings and finished with 15 active listings.

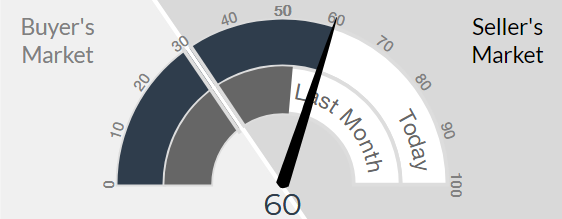
The Altos Research Market Action Index for single-family homes in Santa Clara has risen to 60 from 50 where it was last month. For more detailed reports on Santa Clara and Santa Clara Zip codes, you can access the reports here.
With low inventory, the market is clearly picking up for sellers. We have seen already some price appreciation over last month and homes are selling much quicker.
If you noticed the cost per square foot decreased while median and average home prices have increased don’t be alarmed. To me, that indicates that more large homes rather than small homes sold in November. Larger homes have a lower price per square foot than smaller homes. Just remember, like many metrics, if you follow just one it could mislead you about what is actually going on in the market.
The combination of very low inventory and low rates, is going to cause home values to increase over the next few months. The thing to watch for will be inventory and how quickly inventory increases in the new year. Based on the activity of buyers lately, it will take some time for inventory to overcome the current demand.
Santa Clara Home Sales November 2019
| Street Address | List Price | Price | DOM | Beds Total | Bths | Sq Ft Total | Age |
| 4507 Billings Circle | $2,198,800 | $2,270,000 | 11 | 5 | 4|0 | 2,645 | 15 |
| 356 Burnett Avenue | $1,999,000 | $2,100,000 | 14 | 3 | 2|0 | 1,634 | 63 |
| 3340 Allen Court | $1,798,000 | $1,890,000 | 7 | 3 | 2|0 | 1,400 | 61 |
| 443 Juanita Drive | $1,688,888 | $1,720,000 | 12 | 4 | 3|0 | 1,890 | 67 |
| 658 Bancroft Street | $1,649,000 | $1,700,000 | 15 | 4 | 2|1 | 1,651 | 59 |
| 3460 Flora Vista Avenue | $1,795,888 | $1,700,000 | 37 | 5 | 3|0 | 2,834 | 65 |
| 1722 Santa Cruz Avenue | $1,599,950 | $1,570,000 | 49 | 4 | 2|1 | 2,071 | 62 |
| 201 Tyler Avenue | $1,449,995 | $1,550,000 | 10 | 4 | 2|0 | 1,645 | 69 |
| 2271 Rita Court | $1,525,000 | $1,540,250 | 16 | 4 | 2|0 | 2,027 | 67 |
| 2735 Sonoma Place | $1,388,000 | $1,510,000 | 8 | 4 | 2|0 | 1,704 | 63 |
| 1464 Merrill Place | $1,499,000 | $1,505,000 | 7 | 4 | 4|0 | 2,004 | 14 |
| 260 Calvert Drive | $1,378,000 | $1,500,000 | 7 | 3 | 2|0 | 1,420 | 63 |
| 3068 Atherton Drive | $1,350,000 | $1,500,000 | 14 | 3 | 2|0 | 1,260 | 64 |
| 27 Linden Drive | $1,388,000 | $1,460,000 | 3 | 4 | 2|0 | 2,063 | 71 |
| 2752 Lyle Court | $1,399,000 | $1,460,000 | 9 | 3 | 2|1 | 1,964 | 63 |
| 757 Jill Avenue | $1,475,000 | $1,450,000 | 13 | 5 | 2|0 | 1,957 | 69 |
| 927 Warburton Avenue | $1,498,950 | $1,445,000 | 168 | 4 | 3|0 | 1,945 | 0 |
| 933 Sanchez Place | $1,398,888 | $1,425,000 | 40 | 4 | 3|0 | 2,178 | 0 |
| 3463 Earl Drive | $1,400,000 | $1,420,000 | 5 | 3 | 2|0 | 1,420 | 63 |
| 2483 Gallup Drive | $1,380,000 | $1,412,000 | 7 | 4 | 2|0 | 1,693 | 54 |
| 2235 Homestead Road | $1,299,000 | $1,402,000 | 5 | 3 | 2|0 | 1,543 | 70 |
| 3441 Bella Vista Avenue | $1,299,950 | $1,400,000 | 9 | 3 | 2|0 | 1,512 | 65 |
| 4273 Marston Lane | $1,329,000 | $1,400,000 | 7 | 3 | 2|1 | 1,671 | 16 |
| 2196 Denise Drive | $1,358,000 | $1,388,000 | 7 | 3 | 2|0 | 1,639 | 56 |
| 2261 Rita Court | $1,398,000 | $1,380,000 | 32 | 3 | 1|0 | 1,075 | 67 |
| 2553 Hayward Drive | $1,298,000 | $1,366,888 | 7 | 3 | 2|0 | 1,493 | 64 |
| 1081 Kiely Boulevard | $1,298,000 | $1,360,000 | 9 | 3 | 2|0 | 1,430 | 64 |
| 2755 Warburton Avenue | $1,349,000 | $1,349,000 | 10 | 3 | 2|0 | 1,433 | 61 |
| 2809 Ramona Court | $1,100,000 | $1,330,000 | 5 | 3 | 2|0 | 1,254 | 63 |
| 2618 Warburton Avenue | $1,275,000 | $1,330,000 | 10 | 4 | 2|1 | 1,534 | 63 |
| 4377 Watson Circle | $1,350,000 | $1,303,000 | 83 | 3 | 3|1 | 1,657 | 15 |
| 2564 Elliot Court | $1,300,000 | $1,300,000 | 118 | 4 | 2|0 | 1,290 | 57 |
| 2148 Los Padres Boulevard | $1,199,000 | $1,296,000 | 14 | 3 | 2|0 | 1,314 | 58 |
| 2820 Barcells Avenue | $1,399,000 | $1,280,000 | 20 | 5 | 3|0 | 1,790 | 63 |
| 2163 Hunter Place | $1,269,000 | $1,269,000 | 22 | 4 | 2|1 | 1,796 | 22 |
| 1019 Leith Avenue | $1,249,000 | $1,250,000 | 24 | 4 | 2|0 | 1,594 | 57 |
| 2075 Warburton Avenue | $1,225,000 | $1,220,000 | 18 | 4 | 2|0 | 1,624 | 68 |
| 2380 Forbes Avenue | $1,068,888 | $1,200,000 | 5 | 3 | 2|0 | 1,291 | 64 |
| 2161 Francis Avenue | $1,197,888 | $1,198,888 | 35 | 4 | 2|0 | 1,095 | 61 |
| 1133 Crowley Avenue | $1,049,950 | $1,195,000 | 9 | 3 | 1|1 | 900 | 63 |
| 1125 Los Padres Boulevard | $1,188,000 | $1,150,000 | 51 | 3 | 1|1 | 1,319 | 68 |
| 3581 Butcher Drive | $1,199,888 | $1,125,000 | 34 | 3 | 2|0 | 1,517 | 65 |
| 2479 Crystal Drive | $1,196,800 | $1,120,000 | 49 | 4 | 2|0 | 1,326 | 64 |
| 3543 Cabrillo Avenue | $1,150,000 | $1,090,000 | 9 | 3 | 2|0 | 1,240 | 63 |
| 2218 Francis Avenue | $1,050,000 | $1,030,000 | 3 | 3 | 2|0 | 1,078 | 64 |
| 3350 Snively Avenue | $985,000 | $985,000 | 0 | 3 | 2|0 | 1,166 | 65 |
| 1337 Blackfield Drive | $988,888 | $968,888 | 7 | 3 | 1|0 | 1,006 | 67 |
| 2069 Monroe Street | $749,000 | $775,000 | 10 | 3 | 1|0 | 985 | 65 |
October 2019 home sales CLICK HERE.
September 2019 home sales CLICK HERE.
August 2019 home sales CLICK HERE.
July 2019 home sales CLICK HERE.
June 2019 home sales CLICK HERE.
May 2019 home sales CLICK HERE.
April 2019 home sales CLICK HERE.
March 2019 home sales CLICK HERE.
February 2019 home sales CLICK HERE.
January 2019 home sales CLICK HERE.
December 2018 home sales CLICK HERE.
November 2018 home sales CLICK HERE.
October 2018 home sales CLICK HERE.
September 2018 home sales CLICK HERE.
August 2018 home sales CLICK HERE.
July 2018 home sales CLICK HERE.
June 2018 home sales CLICK HERE.
May 2018 home sales CLICK HERE.
Check out your home’s current value online, quick and free with our new Santa Clara Home Valuation Tool.
http://MySantaClaraHome.com
Get a Detailed Report with all the Sales in your Neighborhood.


