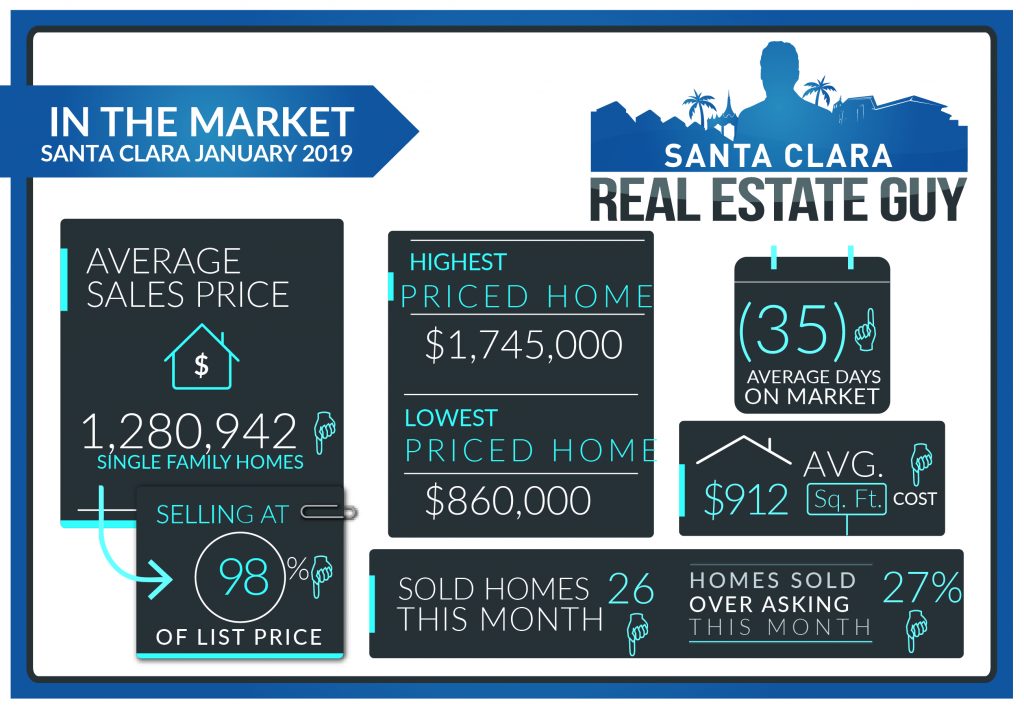
2019 January home sales in Santa Clara consisted of 26 single family homes that closed escrow, a decrease from of the 32 homes sold in December. Average days on market increased to 35 days from 33 the prior month, and median days increased to 27 from 26. The average price of a home sold in January 2019 was $1.28M which is about $20K lower than last month’s figure of $1.3M and $30k lower than the previous month at $1.31M. The Median price home sold was $1.21M, which is below December’s median price of 1.25M. Average cost per square foot increased from $894 per sqft. to $912. Of the 26 homes sold in January, 7 sold over asking. On average 1.8% under asking compared to 0.8% over asking in the previous month.
The market has recently been experiencing multiple offers due to limited or low inventory. Currently, there are 43 homes on the market as of the end of the month. At the beginning of January we started with just 30. At 43 single family homes, the market is fairly tight and options are limited for buyers. As inventory increases to 60 expect that homes will take longer to sell. For the first time in years the percentage of list price dipped below 100%. Keep in mind that January closings are reflecting December sales.
| Street Address | List Price | Price | DOM | Beds | Bths | Sq Ft | Age |
| 3255 Mauricia Avenue | $1,849,000 | $1,745,000 | 38 | 4 | 2|0 | 1,568 | 60 |
| 1055 Helen Avenue | $1,748,000 | $1,720,000 | 15 | 4 | 3|1 | 2,227 | 0 |
| 507 Hubbard Avenue | $1,698,000 | $1,635,000 | 71 | 3 | 2|0 | 1,333 | 59 |
| 466 Muriel Court | $1,700,000 | $1,600,000 | 13 | 3 | 2|0 | 1,442 | 58 |
| 3375 Cabrillo Avenue | $1,580,000 | $1,560,000 | 51 | 5 | 3|0 | 1,998 | 59 |
| 2132 Rockhurst Court | $1,550,000 | $1,550,000 | 6 | 3 | 2|0 | 1,302 | 61 |
| 840 Civic Center Drive | $1,645,000 | $1,550,000 | 39 | 4 | 3|1 | 1,805 | 0 |
| 2837 Sycamore Way | $1,500,000 | $1,500,000 | 0 | 4 | 2|1 | 1,830 | 59 |
| 1635 Cunningham Street | $1,449,950 | $1,500,000 | 7 | 3 | 2|0 | 1,912 | 68 |
| 2185 Cabrillo Avenue | $1,399,000 | $1,410,000 | 57 | 3 | 2|0 | 2,052 | 64 |
| 2946 Taper Avenue | $1,199,000 | $1,375,000 | 8 | 4 | 3|0 | 1,836 | 61 |
| 2419 Brannan Place | $1,249,000 | $1,251,500 | 14 | 3 | 2|0 | 1,231 | 62 |
| 661 Fairlane Avenue | $1,388,000 | $1,223,000 | 20 | 4 | 2|0 | 1,651 | 58 |
| 1827 Laine Avenue | $1,248,000 | $1,200,000 | 56 | 3 | 2|0 | 1,310 | 66 |
| 245 Monroe Street | $1,250,000 | $1,200,000 | 203 | 3 | 2|0 | 1,344 | 90 |
| 1323 Kiely Boulevard | $1,199,990 | $1,199,990 | 38 | 3 | 2|0 | 2,095 | 62 |
| 564 Chapman Court | $998,000 | $1,150,000 | 12 | 3 | 2|0 | 1,170 | 93 |
| 2355 Fosgate Avenue | $1,145,000 | $1,090,000 | 38 | 3 | 1|0 | 1,016 | 64 |
| 3600 Macgregor Lane | $1,070,000 | $1,070,000 | 51 | 3 | 1|0 | 1,106 | 48 |
| 2347 Warburton Avenue | $1,098,000 | $1,070,000 | 8 | 3 | 1|0 | 1,021 | 68 |
| 2414 Crystal Drive | $949,000 | $1,005,000 | 7 | 3 | 1|0 | 897 | 63 |
| 2032 Main Street | $1,198,000 | $1,000,000 | 8 | 4 | 2|0 | 1,292 | 83 |
| 4390 Bassett Street | $990,000 | $990,000 | 56 | 3 | 2|0 | 1,155 | 83 |
| 1912 Bellomy Street | $978,800 | $965,000 | 49 | 2 | 1|0 | 827 | 67 |
| 2527 Malone Place | $1,088,000 | $885,000 | 0 | 4 | 3|0 | 1,900 | 62 |
| 1407 Main Street | $850,000 | $860,000 | 43 | 2 | 1|0 | 832 | 29 |
December 2018 home sales CLICK HERE.
November 2018 home sales CLICK HERE.
October 2018 home sales CLICK HERE.
September 2018 home sales CLICK HERE.
August 2018 home sales CLICK HERE.
July 2018 home sales CLICK HERE.
June 2018 home sales CLICK HERE.
May 2018 home sales CLICK HERE.
Check out your home’s current value online, quick and free with our new Santa Clara Home Valuation Tool.
https://SantaClara.freehomevalues.net
Planning to sell or just want to stay on top of the market, get our professional MARKET REPORTS by Altos Research. Monitor inventory, prices, and market changes.
To Sign up for Free Market Reports:


