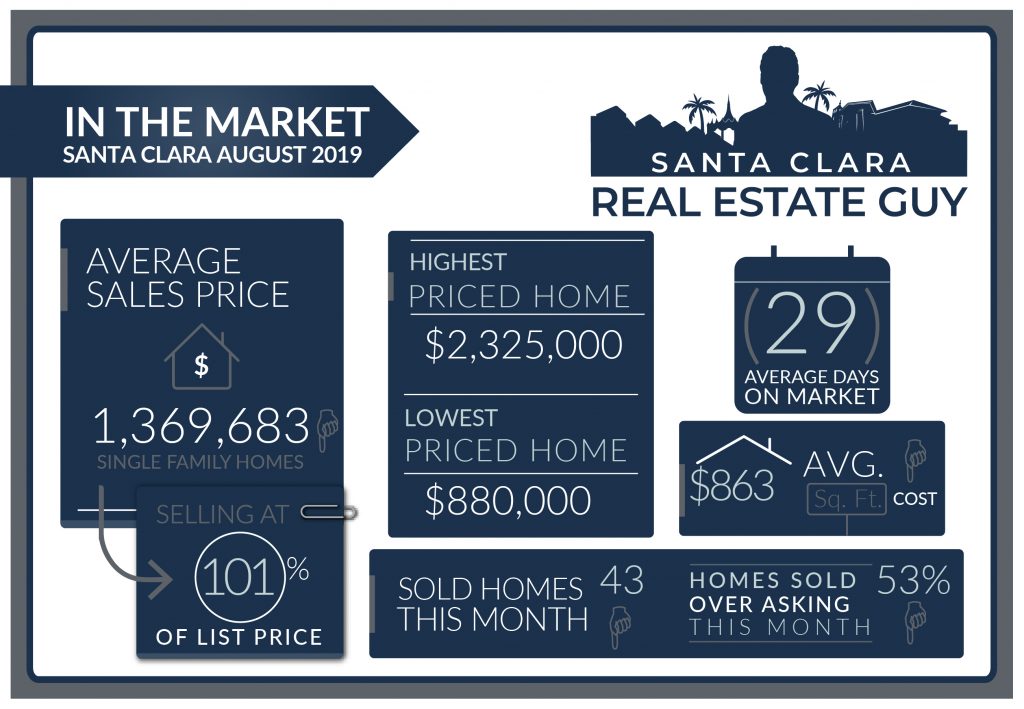
2019 August home sales in Santa Clara consisted of 43 single-family homes that closed escrow, a decrease from the 56 homes sold in July. Average days on market increased to 29 days from 25 days, and median days increased to 15 from 14. The average price of a home sold in August 2019 was $1.37M which is about $30K lower than last month’s figure of $1.4M.
The Median price home sold was $1.3M, which is about $60K lower than July’s median price. The average cost per square foot decreased from $887 per sqft. to $827. Of the 43 homes sold in July, 23 sold over asking. On average 0.8% over asking compared to 1.2% over asking in the previous month.

We are experiencing an interesting market. Inventory has dropped and sales have dropped, interest rates are also very low, but prices continue to settle lower. Our current market is demonstrating that buyers are being very patient in their home-buying decisions, and motivated sellers are dropping their prices to entice offers.
Now that the summer is coming to an end, and school is back in session we have noticed a higher uptick in inventory from August. This will likely continue the trend of the market softening until things tighten up in the winter. How much, well that depends on inventory.
As always be sure to continue to monitor the inventory trends. Especially in the next couple of weeks, because it will tell us about what to expect in the months ahead.
For sellers, buyers need to have a compelling reason to buy your home, and that compelling reason maybe price. If you don’t want it to be the price, you have to look at other reasons to build value in the eyes of the buyers.
Buyers, the conditions for buying continue to be better. Rates are lower and prices are settling. No one is absolutely sure where the market is headed, but now you have the fortune of being more selective on your real estate decision. Here is a recent video I did regarding some buyers I helped recently.
Santa Clara Home Sales August 2019
| Street Address | List Price | Price | DOM | Beds Total | Bths | Sq Ft Total | Age |
| 2751 Forbes Avenue | $1,430,000 | $1,300,000 | 51 | 3 | 3|0 | 1,931 | 64 |
| 1463 Blackfield Drive | $1,199,900 | $1,100,000 | 54 | 4 | 2|0 | 1,790 | 67 |
| 2349 Menzel Place | $1,379,000 | $1,270,000 | 40 | 4 | 3|0 | 1,807 | 65 |
| 1901 Worthington Circle | $1,998,000 | $1,881,350 | 13 | 4 | 3|0 | 2,390 | 6 |
| 4003 Cheeney Street | $998,000 | $940,000 | 57 | 2 | 1|0 | 1,164 | 72 |
| 673 Malarin Avenue | $1,298,000 | $1,235,000 | 90 | 4 | 3|0 | 1,946 | 68 |
| 2734 Barkley Avenue | $1,340,000 | $1,278,000 | 50 | 8 | 4|0 | 2,218 | 63 |
| 4672 Wilcox Avenue | $1,199,999 | $1,156,000 | 63 | 3 | 2|1 | 1,599 | 21 |
| 4173 Marston Lane | $1,499,800 | $1,450,000 | 30 | 3 | 2|1 | 1,754 | 16 |
| 3216 San Juan Avenue | $1,699,500 | $1,652,000 | 47 | 4 | 3|0 | 1,885 | 0 |
| 2455 Painted Rock Drive | $1,200,000 | $1,170,000 | 4 | 3 | 2|0 | 1,448 | 65 |
| 590 Park Court | $1,149,000 | $1,125,000 | 57 | 3 | 1|0 | 1,434 | 94 |
| 2665 Maplewood Lane | $1,999,950 | $1,968,000 | 71 | 3 | 2|0 | 2,146 | 49 |
| 2481 Austin Place | $1,250,000 | $1,240,000 | 7 | 3 | 2|0 | 1,340 | 62 |
| 2497 Hart Avenue | $1,350,000 | $1,340,000 | 26 | 3 | 2|0 | 1,340 | 62 |
| 1711 Santa Cruz Avenue | $1,680,000 | $1,670,000 | 42 | 3 | 3|0 | 2,168 | 9 |
| 2360 Harrison Street | $1,199,999 | $1,192,999 | 7 | 3 | 2|0 | 1,229 | 64 |
| 1679 Los Padres Boulevard | $1,100,000 | $1,100,000 | 9 | 3 | 2|0 | 1,121 | 69 |
| 462 Muriel Court | $1,898,000 | $1,898,000 | 64 | 5 | 3|0 | 2,423 | 59 |
| 1922 Worthington Circle | $1,499,000 | $1,499,000 | 95 | 3 | 2|1 | 1,905 | 5 |
| 1186 Los Padres Boulevard | $1,199,000 | $1,200,000 | 14 | 3 | 1|1 | 1,330 | 65 |
| 412 Greenwood Drive | $1,198,000 | $1,200,000 | 20 | 3 | 2|0 | 1,543 | 52 |
| 2388 Manhattan Place | $1,350,000 | $1,355,000 | 45 | 3 | 2|0 | 1,034 | 61 |
| 998 Garrity Way | $1,999,000 | $2,007,000 | 54 | 3 | 2|1 | 3,044 | 17 |
| 4645 Armour Drive | $1,075,000 | $1,080,000 | 5 | 5 | 3|0 | 1,994 | 59 |
| 724 Nicholson Avenue | $1,398,000 | $1,412,000 | 10 | 3 | 2|0 | 1,254 | 64 |
| 2639 Toledo Avenue | $1,325,000 | $1,340,000 | 8 | 3 | 2|0 | 1,166 | 65 |
| 2612 Monticello Way | $1,549,000 | $1,570,000 | 23 | 4 | 3|0 | 1,591 | 59 |
| 3126 San Juan Avenue | $1,349,000 | $1,380,000 | 8 | 4 | 3|0 | 2,033 | 61 |
| 4250 Marston Lane | $1,688,000 | $1,730,000 | 8 | 4 | 3|1 | 2,083 | 17 |
| 4724 Mangrum Drive | $975,000 | $1,000,000 | 51 | 4 | 2|0 | 1,167 | 59 |
| 546 Woodstock Way | $1,198,000 | $1,230,000 | 15 | 4 | 2|0 | 1,666 | 51 |
| 4171 Rivermark Parkway | $2,249,000 | $2,325,000 | 10 | 5 | 4|0 | 3,113 | 16 |
| 1863 Clifford Street | $849,000 | $880,000 | 7 | 2 | 1|0 | 766 | 73 |
| 4669 Snead Drive | $1,050,000 | $1,090,000 | 8 | 3 | 2|0 | 1,095 | 59 |
| 1791 Clay Street | $1,298,000 | $1,350,000 | 9 | 3 | 2|0 | 1,375 | 130 |
| 2632 Toledo Avenue | $1,495,000 | $1,597,000 | 12 | 4 | 2|0 | 1,884 | 62 |
| 1189 Inverness Avenue | $1,448,888 | $1,560,000 | 6 | 3 | 3|0 | 2,011 | 68 |
| 795 Hilmar Street | $1,175,000 | $1,270,000 | 7 | 3 | 2|0 | 1,400 | 78 |
| 3146 San Juan Avenue | $1,288,000 | $1,395,000 | 31 | 3 | 2|0 | 1,095 | 61 |
| 285 Crestview Drive | $1,198,000 | $1,305,000 | 7 | 3 | 2|0 | 1,351 | 63 |
| 1671 Triton Court | $1,100,000 | $1,200,000 | 8 | 3 | 2|1 | 1,730 | 29 |
| 2612 Meadowbrook Drive | $799,000 | $955,000 | 7 | 2 | 1|0 | 754 | 64 |
July 2019 home sales CLICK HERE.
June 2019 home sales CLICK HERE.
May 2019 home sales CLICK HERE.
April 2019 home sales CLICK HERE.
March 2019 home sales CLICK HERE.
February 2019 home sales CLICK HERE.
January 2019 home sales CLICK HERE.
December 2018 home sales CLICK HERE.
November 2018 home sales CLICK HERE.
October 2018 home sales CLICK HERE.
September 2018 home sales CLICK HERE.
August 2018 home sales CLICK HERE.
July 2018 home sales CLICK HERE.
June 2018 home sales CLICK HERE.
May 2018 home sales CLICK HERE.
Check out your home’s current value online, quick and free with our new Santa Clara Home Valuation Tool.
Planning to sell or just want to stay on top of the market, get our professional MARKET REPORTS by Altos Research. Monitor inventory, prices, and market changes.
To Sign up for Free Market Reports:


