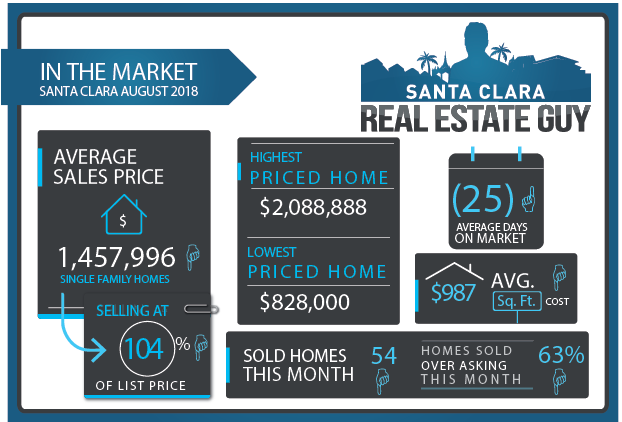
2018 Santa Clara August home sales in Santa Clara consisted of 54 single family homes that closed escrow, a slight decrease from of the low 56 homes sold in July. Traditionally August can be the slowest month of the year for real estate in the area. Average days on market increased a whole week to 25 days from 18 the prior month, and median days increased to 16 from 12. The average price of a home sold in July 2018 was $1.458M which is about $40K lower than last month’s figure of $1.498M and $140k lower than the previous month at $1.594M. The Median price a home sold was $1.480M, which is $11K above July’s median price. Average cost per square foot dipped below $1000 per sqft. to $987. Of the 54 homes sold in June, 34 sold over asking on average 4.2% over asking compared to 7% over asking in the previous month. The most interesting aspect is that only 37 new listings were added in August. Consequentially inventory fell significantly from the prior month a total of 17 homes or close to 25%. Prices have settled a bit further down and activity is still slow (remember August is typically a slow month). However, if buying activity picks up in the fall look for the market tighten as inventory decreases and prices may even increase a bit from where we are now. Buyers expect multiple offers coming up ahead. Seller’s the fall and winter may be good markets to sell in and get better pricing than the last two months.
| Street Address | List Price | Sale Price | DOM | BD | BA | Sq Ft | Age |
| 1165 Pomeroy Avenue | $1,295,000 | $1,188,000 | 39 | 3 | 2|0 | 1,208 | 69 |
| 1196 Phillips Court | $1,365,000 | $1,300,000 | 37 | 2 | 2|0 | 1,000 | 62 |
| 1217 Harrison Street | $1,589,000 | $1,620,000 | 8 | 4 | 3|0 | 1,816 | 148 |
| 1235 Benton Street | $828,000 | $782,800 | 120 | 2 | 1|0 | 840 | 90 |
| 1426 Newhall Street | $1,299,950 | $1,325,000 | 31 | 3 | 2|0 | 1,412 | 72 |
| 1470 Lincoln Street | $1,398,000 | $1,511,000 | 9 | 3 | 2|1 | 1,941 | 11 |
| 1687 Roll Street | $1,599,000 | $1,520,000 | 14 | 3 | 2|0 | 1,427 | 67 |
| 172 N Henry Avenue | $1,999,888 | $2,000,000 | 34 | 4 | 2|0 | 2,325 | 67 |
| 1767 Pomeroy Avenue | $1,649,888 | $1,650,000 | 29 | 4 | 2|0 | 1,464 | 64 |
| 1809 Henning Place | $1,299,000 | $1,285,000 | 56 | 3 | 2|1 | 1,960 | 20 |
| 1850 Briarwood Drive | $1,599,888 | $1,561,000 | 15 | 3 | 2|0 | 1,608 | 64 |
| 1865 Washington St | $995,000 | $1,020,000 | 12 | 3 | 1|0 | 1,155 | 73 |
| 189 Gilbert Avenue | $2,088,888 | $2,060,000 | 26 | 3 | 2|0 | 1,820 | 60 |
| 2037 Jamison Place | $1,498,000 | $1,650,000 | 8 | 4 | 3|0 | 2,094 | 25 |
| 2061 Nobili Avenue | $1,388,000 | $1,458,000 | 23 | 4 | 2|0 | 1,240 | 62 |
| 2065 Don Court | $995,000 | $1,135,000 | 9 | 3 | 1|0 | 985 | 64 |
| 208 Cronin Drive | $1,698,888 | $1,728,000 | 55 | 3 | 2|0 | 1,388 | 60 |
| 2127 Santa Cruz Ave | $1,220,000 | $1,220,000 | 0 | 3 | 2|0 | 1,078 | 63 |
| 2148 Forbes Avenue | $1,155,000 | $1,155,000 | 0 | 3 | 1|0 | 980 | 67 |
| 2177 Augusta Place | $1,198,000 | $1,410,000 | 9 | 3 | 2|0 | 1,095 | 60 |
| 2210 Brown Avenue | $1,388,000 | $1,480,000 | 14 | 3 | 2|0 | 1,536 | 60 |
| 2211 De Paul Place | $1,475,000 | $1,680,000 | 7 | 4 | 2|0 | 1,864 | 60 |
| 2221 Sutter Avenue | $1,495,000 | $1,500,000 | 24 | 4 | 2|0 | 1,350 | 63 |
| 2301 Alcalde Street | $1,650,000 | $1,735,000 | 9 | 5 | 3|0 | 2,326 | 21 |
| 2440 Benton Street | $1,250,000 | $1,285,000 | 30 | 3 | 2|0 | 1,134 | 63 |
| 2525 Armstrong Place | $900,000 | $980,000 | 34 | 3 | 2|0 | 1,340 | 61 |
| 2554 Elliot Court | $1,299,000 | $1,312,000 | 18 | 3 | 2|0 | 1,191 | 56 |
| 2609 Elliot Street | $1,488,000 | $1,525,000 | 9 | 4 | 2|0 | 1,315 | 59 |
| 2682 Wallace Street | $1,405,000 | $1,300,000 | 30 | 4 | 2|1 | 1,602 | 63 |
| 2820 Pruneridge Ave | $1,950,000 | $1,958,000 | 96 | 4 | 3|0 | 2,059 | 43 |
| 2892 Sycamore Way | $1,799,000 | $1,725,000 | 22 | 4 | 2|1 | 1,749 | 58 |
| 2969 Withrow Place | $1,338,000 | $1,350,000 | 36 | 3 | 2|0 | 1,339 | 62 |
| 317 Montclair Drive | $1,799,000 | $1,715,000 | 14 | 4 | 2|1 | 1,740 | 61 |
| 322 Madrone Avenue | $1,798,000 | $1,980,000 | 6 | 4 | 2|1 | 1,749 | 55 |
| 3330 Cecil Avenue | $1,519,000 | $1,500,000 | 20 | 3 | 2|0 | 1,410 | 66 |
| 3374 Gonzaga Place | $1,450,000 | $1,570,000 | 8 | 3 | 2|0 | 1,332 | 60 |
| 3447 Bella Vista Ave | $1,298,888 | $1,575,000 | 8 | 3 | 2|0 | 1,212 | 64 |
| 3572 Gibson Avenue | $1,400,000 | $1,580,000 | 15 | 3 | 2|0 | 1,800 | 61 |
| 3729 De La Cruz Blvd | $1,150,000 | $1,210,000 | 11 | 4 | 2|0 | 1,745 | 51 |
| 445 N Cypress Avenue | $1,338,800 | $1,275,000 | 32 | 3 | 1|0 | 1,075 | 66 |
| 4516 Lakeshore Dr | $1,200,000 | $1,162,000 | 11 | 4 | 2|1 | 1,850 | 41 |
| 4626 Lakeshore Drive | $1,359,950 | $1,360,000 | 75 | 4 | 2|0 | 1,584 | 41 |
| 4634 Mangrum Drive | $1,188,000 | $1,270,000 | 16 | 4 | 2|0 | 1,167 | 58 |
| 4668 Wilcox Avenue | $1,348,000 | $1,445,000 | 36 | 4 | 2|1 | 1,685 | 20 |
| 4703 Mangrum Drive | $1,075,000 | $1,250,000 | 7 | 4 | 2|0 | 1,707 | 58 |
| 526 Madison Street | $995,000 | $1,200,000 | 15 | 3 | 2|0 | 1,328 | 58 |
| 613 Malarin Avenue | $1,249,888 | $1,230,000 | 39 | 3 | 1|0 | 980 | 67 |
| 631 Woodhams Road | $1,599,000 | $1,600,000 | 42 | 4 | 3|0 | 2,067 | 57 |
| 67 Cabot Avenue | $1,488,000 | $1,600,000 | 9 | 4 | 2|0 | 2,157 | 8 |
| 683 Starr Court | $1,495,000 | $1,660,000 | 8 | 3 | 2|0 | 1,145 | 63 |
| 861 Clyde Avenue | $1,088,000 | $1,100,000 | 31 | 4 | 2|0 | 1,314 | 57 |
| 902 Pomeroy Avenue | $1,895,000 | $1,775,000 | 62 | 4 | 3|0 | 2,430 | 11 |
| 981 Civic Center Drive | $1,038,000 | $1,318,000 | 5 | 3 | 2|1 | 1,353 | 13 |
| 991 Fairfield Avenue | $1,499,000 | $1,520,000 | 43 | 3 | 1|1 | 1,602 | 65 |
to compare with last months:
July 2018 home sale CLICK HERE.
June 2018 home sale CLICK HERE.
May 2018 home sales CLICK HERE.
Check out your home’s current value online, quick and free with our new Santa Clara Home Valuation Tool.
https://SantaClara.freehomevalues.net
Planning to sell or just want to stay on top of the market, get our professional MARKET REPORTS by Altos Research. Monitor inventory, prices, and market changes.
To Sign up for Free Market Reports:


