April Santa Clara Home Sales Recap
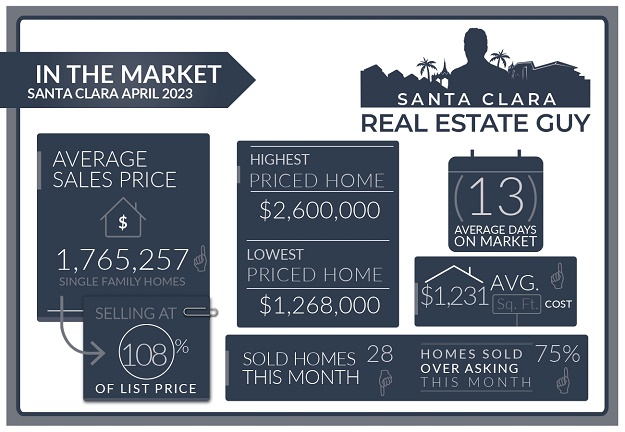
The Santa Clara housing market in April experienced 28 single-family homes that closed escrow, which is 2 less than closed escrow in the previous month of March. For some more perspective, last year there were 59 homes sold in April.
The average price of a home sold in April was $1.77M which is about $83K higher than the previous month’s figure of $1.68M. The median price home sold was $1.74M, about $132K higher than the median price in March.
The average cost per square foot saw an increase from $1141 per Sq. Ft. to $1,231 per Sq. Ft.
Of all the 28 homes sold in April, 21 homes sold over the list price. On average homes that sold did so at 9.04% over asking compared to 6.64% over asking in the previous month.
We started the month of April with 34 active single-family home listings and finished with 35 active single-family homes for sale in all of Santa Clara.
There were 30 single-family homes that accepted contracts in the month of April and 34 new single-family home listings that were listed in April.
For a list of sold homes in April click here or scroll down to the bottom of the page.
Home Sales Down Year Over Year
The number of homes for sale in Santa Clara continues to be low.
When we refer to a slow market we are generally referring to how quickly homes are selling.
In our current market, homes are selling quickly if priced accurately or lower than market value. The market in April definitely strengthened as more homes sold for higher than the list price.
With such low inventory and limited good options, it’s definitely a seller’s market as motivated buyers have few options.
However, unlike previous strong seller’s markets, buyers realize prices are not increasing and are being picky.
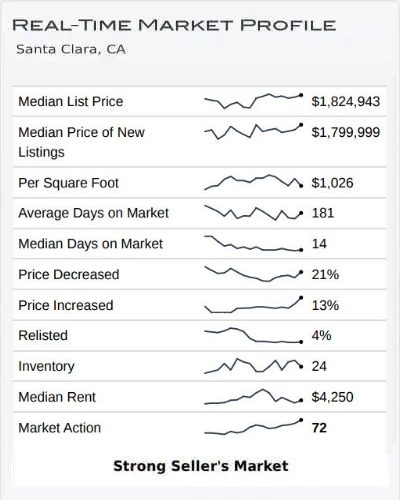
Altos Research Market Data For Santa Clara
Inventory is on the Rise
Typical Spring markets is when you would see an influx of homes coming on the market, and we are starting to see more homes.
Inventory levels are the highest they have been all year.
Inventory of homes for sale is to me the best indicator of where a market is heading.
One easy way to track the market is with the Altos Research – Market Action Index (MAI). The MAI is a proprietary metric that measures inventory and sales activity. The MAI was trending upward indicating that the market is getting stronger for sellers.
MAI has been trending upward in the last few weeks indicating the market is strengthening for sellers.
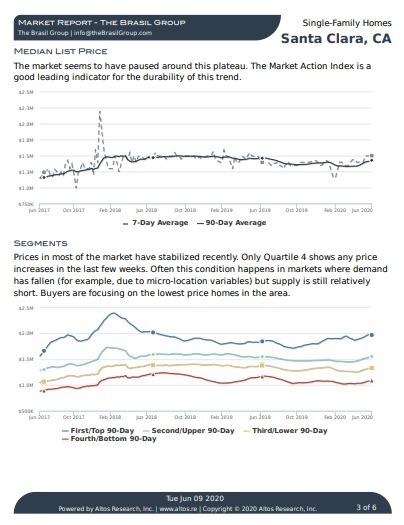
Santa Clara Market Reports
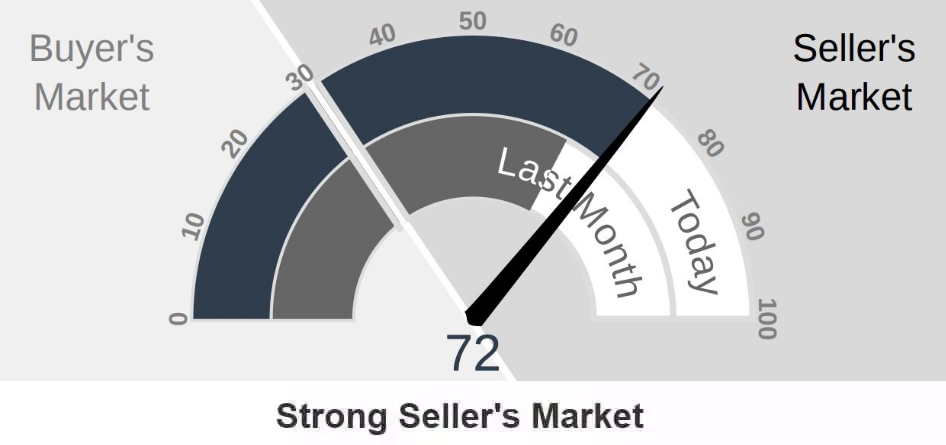
The Altos Research Market Action Index for single-family homes in Santa Clara has increased to 72 from 64 where it was last month. For more detailed reports on Santa Clara and Santa Clara Zip codes, you can access the reports here.
Santa Clara Report
95051 Report
95050 Report
95054 Report
Home Values on the Rise
Home values under the current low inventory conditions are rising. In previous years we have seen large gains in home value appreciation at the beginning of the year.
This year those gains have been much more gradual than in previous years.
Both the median price of a home sold and the price per square foot increased in Santa Clara last month. This is typical in the Spring as better homes are on the market relative to the homes that sold late the previous year or earlier in the year.
Some of the appreciation indicated in the numbers above may not necessarily be actual appreciation but a reflection of homes that have sold recently are better condition and more desirable neighborhoods.
Other Factors Influencing the Market:
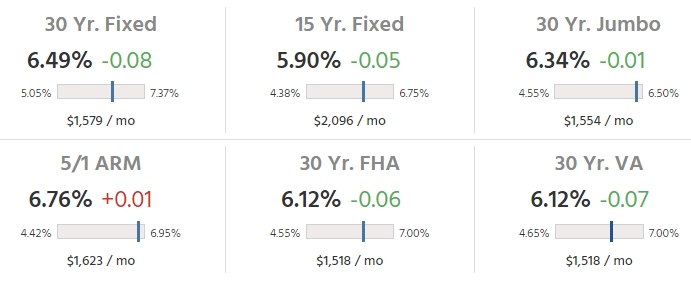
Mortgage rates have been fairly steady around 6.5%.
FED did raise their Fed Funds rate another 25 points but the mortgage rates were relatively unaffected. The market seems confident that this will be the last increase by the FED, and some suspect that the FED will start to drop rates in the Summer.
A drop in rates by the FED would likely result in a jolt to the stock market and a boost of confidence to buyers, and this could happen as early as this Summer according to some analysts.
Markets Year to Date
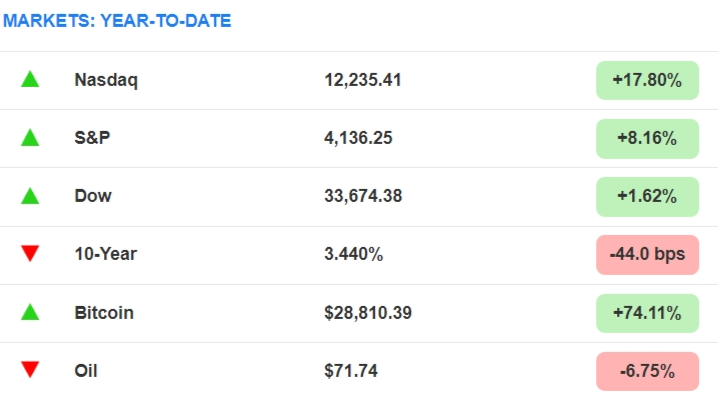
Stock market continues to be healthy, especially stock from local tech companies providing a boost to local home buyers.
Home buyers in our local market rely on tech stocks for their down payment and for their loan qualifications. The impact on stock values affects home buyer affordability and purchasing power.
Since the beginning of the year, the stock market has been rallying with pauses and drops.
Recently the Nasdaq which is a tech-heavy growth stock index has been performing well as investors are bullish that the FED will stop raising rates.
Save thousands when you sell.
Includes Free Staging and Our Complete Selling Solution
* Total commission 4% including buyer side agent commission of 2.5%, offer varies by value of home.
What to Expect Moving Forward
Buyers, have we hit the bottom? Possibly.
If you follow real estate you will know that we are entering the Spring and Summer markets where the market typically cools as there are more homes on the market.
Generally that means that prices will settle in the coming weeks and months.
If you have been looking for a few weeks you probably feel like the market has picked up and it has.
With the current state of rates, stocks, and low home inventory buyers are definitely feeling a bit more confident these days.
If you factor in that the FED just increased rates for the last time this year, and may even start to lower rates in just a few months, then you have to be thinking that this market may even start to heat up more.
Of course all this is speculation, but it seems like inflation is not as big of a factor anymore. Now concerns are shifting to the economy. My advice to buyers is to continue to shop and be very active. Now is a great time to shop as you should have lots of options.
Sellers, the number of homes for sale is increasing. So there is more competition out there if you are selling your home than there has been all year.
Currently inventory levels are around 40 which typically isn’t a lot of homes, but our market isn’t as strong as previous markets so it will be interesting to see how the market responds.
If inventory continues to increase expect to see homes taking longer to sell, and potentially some price drops.
If rates do drop in the Summer as some expect more buyers to enter the market. This could send the market higher even if inventory levels increase in the next few weeks and months.
My advice to sellers is if you want to make a move especially if you are thinking of making a move to a market where there is more new construction and supply of homes like Nevada, Idaho, and Texas then this market may be a great opportunity.
These markets are much slower than our current market, and in some cases, buyers are able to make contingent offers on new homes allowing them to sell their home before buying their new home.
There are lots of reasons why selling and buying in this market makes sense. Here is an article I wrote on the advantages of selling in slow markets.
Instead of offering general suggestions here, I would encourage sellers who have questions and concerns about selling in this market to reach out to an agent.
Understanding your specific situation helps in determining how this market will affect you and your options. I offer free consultations to buyers and sellers to discuss their needs, so please reach out, I am always happy to help.
Conclusion:
As always, whether you are buying or selling, understanding the current market will set you up for success. As I mentioned above some homes are doing quite well in this market.
Understand that the housing stock of Santa Clara is very diverse and can vary greatly from one neighborhood to the next.
Developing the right strategy for you, whether you are buying a home or thinking of selling your current home is important to succeeding in this market.
If you have any questions about a home on the market or your home’s value, please feel free to reach out, I am happy to meet and help you understand your options.
Contact Me Today
Have a question? Interested in setting an appointment to talk about your real estate plans? Contact me today.

Message Me Directly:
Santa Clara April 2023 Home Sales
| Street Address | List Price | Price | DOM | Beds Total | Bths | Sq Ft Total | Age |
| 4217 Rivermark Parkway | $2,860,000 | $2,600,000 | 21 | 4 | 3|1 | 3,073 | 20 |
| 530 Meadow Avenue | $1,950,000 | $2,300,000 | 9 | 3 | 2|0 | 1,508 | 64 |
| 3491 Elmhurst Avenue | $1,999,888 | $2,280,000 | 9 | 4 | 2|1 | 1,947 | 66 |
| 646 Hudson Drive | $2,098,000 | $2,200,000 | 6 | 3 | 2|0 | 1,350 | 67 |
| 714 Valley Way | $1,990,000 | $2,048,800 | 8 | 4 | 2|0 | 1,811 | 63 |
| 3318 Vanderbilt Way | $2,200,000 | $2,025,000 | 23 | 6 | 3|1 | 2,479 | 62 |
| 2236 Serra Avenue | $1,795,000 | $2,000,000 | 6 | 3 | 2|0 | 1,653 | 73 |
| 779 Armanini Avenue | $1,798,888 | $1,930,000 | 8 | 4 | 3|0 | 1,532 | 73 |
| 951 Camino Drive | $1,999,000 | $1,928,888 | 10 | 4 | 3|0 | 1,536 | 72 |
| 2672 Forbes Avenue | $1,900,000 | $1,900,000 | 62 | 4 | 2|0 | 1,611 | 69 |
| 2991 Withrow Place | $1,648,888 | $1,850,000 | 7 | 3 | 2|0 | 1,339 | 67 |
| 2260 Menzel Place | $1,799,888 | $1,815,000 | 0 | 3 | 2|0 | 1,566 | 69 |
| 3373 Creighton Place | $1,338,000 | $1,800,000 | 8 | 3 | 2|0 | 1,414 | 65 |
| 627 Los Olivos Drive | $1,798,000 | $1,768,000 | 12 | 3 | 2|1 | 1,876 | 68 |
| 2070 Clark Avenue | $1,450,000 | $1,705,000 | 4 | 3 | 2|0 | 1,315 | 64 |
| 2471 Johnson Place | $1,589,000 | $1,700,000 | 6 | 3 | 2|0 | 1,231 | 67 |
| 3040 Santa Maria Avenue | $1,398,000 | $1,650,000 | 5 | 3 | 2|0 | 1,078 | 68 |
| 2473 Brannan Place | $1,295,000 | $1,600,000 | 8 | 3 | 2|0 | 1,266 | 68 |
| 361 Condon Court | $1,348,888 | $1,580,000 | 6 | 3 | 2|0 | 1,130 | 68 |
| 3385 Fowler Avenue | $1,425,000 | $1,555,500 | 9 | 3 | 2|0 | 1,080 | 69 |
| 1726 Townsend Avenue | $1,325,000 | $1,550,000 | 9 | 3 | 2|0 | 1,190 | 69 |
| 2371 Monroe Street | $1,489,000 | $1,475,000 | 78 | 4 | 2|0 | 1,288 | 55 |
| 588 Saratoga Avenue | $1,499,000 | $1,475,000 | 13 | 3 | 2|0 | 1,694 | 76 |
| 3565 Notre Dame Drive | $1,199,000 | $1,450,000 | 5 | 3 | 2|0 | 1,302 | 66 |
| 1167 Fairfield Avenue | $1,200,000 | $1,343,000 | 15 | 2 | 1|0 | 1,248 | 73 |
| 1761 Franck Avenue | $1,199,000 | $1,320,000 | 3 | 3 | 2|0 | 1,038 | 70 |
| 3060 Machado Avenue | $1,150,000 | $1,310,000 | 4 | 3 | 1|0 | 994 | 68 |
| 1946 Jackson Street | $1,200,000 | $1,268,000 | 6 | 3 | 1|0 | 985 | 69 |
Santa Clara Housing Market Archive
April 2023 home sales CLICK HERE.
January 2023 home sales CLICK HERE.
December 2022 home sales CLICK HERE.
November 2022 home sales CLICK HERE.
October 2022 home sales CLICK HERE.
September 2022 home sales CLICK HERE.
August 2022 home sales CLICK HERE.
July 2022 home sales CLICK HERE.
June 2022 home sales CLICK HERE.
April 2022 home sales CLICK HERE.
March 2022 home sales CLICK HERE.
February 2022 home sales CLICK HERE.
December 2021 home sales CLICK HERE.
November 2021 home sales CLICK HERE.
October 2021 home sales CLICK HERE.
September 2021 home sales CLICK HERE.
July 2021 home sales CLICK HERE.
May 2021 home sales CLICK HERE.
April 2021 home sales CLICK HERE.
March 2021 home sales CLICK HERE.
February 2021 home sales CLICK HERE.
January 2021 home sales CLICK HERE.
November 2020 home sales CLICK HERE.
October 2020 home sales CLICK HERE.
September 2020 home sales CLICK HERE.
August 2020 home sales CLICK HERE.
July 2020 home sales CLICK HERE.
June 2020 home sales CLICK HERE.
May 2020 home sales CLICK HERE.
April 2020 home sales CLICK HERE.
March 2020 home sales CLICK HERE.
January 2020 home sales CLICK HERE.
