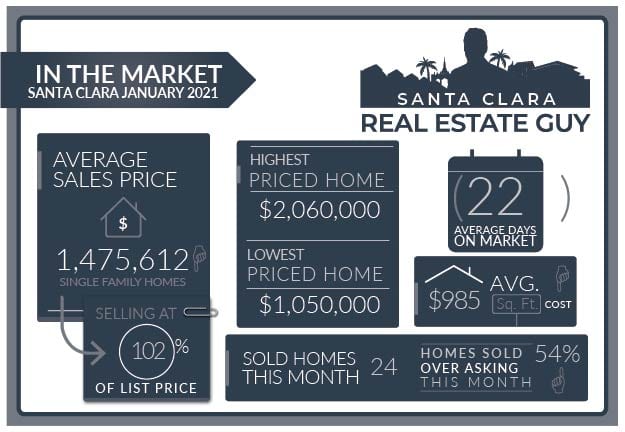
The Santa Clara housing market in January experienced 24 single-family homes that closed escrow, which is 20 less that closed escrow in the previous month of December.
The average price of a home sold in January was $1.47M which is about $60K Higher than last month’s figure of $1.41M. The Median price home sold was $1.41M, which is about $20K higher than December’s median price.
The average cost per square foot stayed about the same around $985 per Sq. Ft. to $986. Of the 24 homes sold in January, 13 sold over the list price.
On average homes that sold, sold 2.0% over asking compared to 5.8% over asking in the previous month.
We started the month of January with 18 active single-family home listings and finished with 24 in all of Santa Clara.
In typical beginning of the year fashion, the local Santa Clara market has been very hot. Hot meaning, homes are selling fast, receiving multiple offers, buyers are overbidding, and home values are increasing.
One thing to keep in mind about December and the end of the year is that generally homes sold at the end of the year are not in very good condition, and this can sometimes bring down the median value of a home sold. In our case the median price of a home sold increased pretty substantially from December to January, indicating a very HOT market.
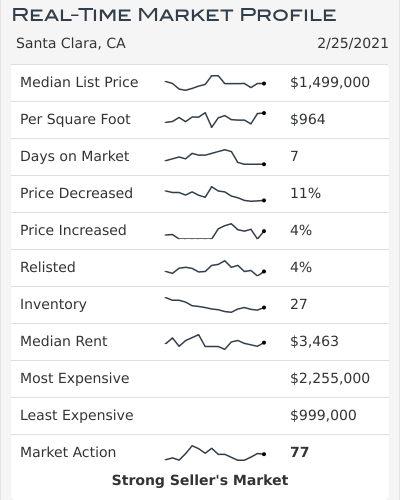
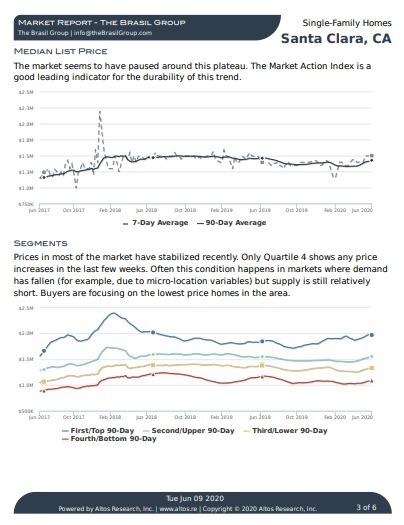
Altos Research Market Data For Santa Clara
Inventory of homes in Santa Clara has been increasing from 18 homes at the beginning of the year to 24 homes on February 1st, to about 30 homes where we stand now as of today (2/23/2021).
Moving forward inventory is going to continue to rise. The big question is how quickly. At 30 homes the Santa Clara market will still be a strong sellers market.
Santa Clara Market Reports
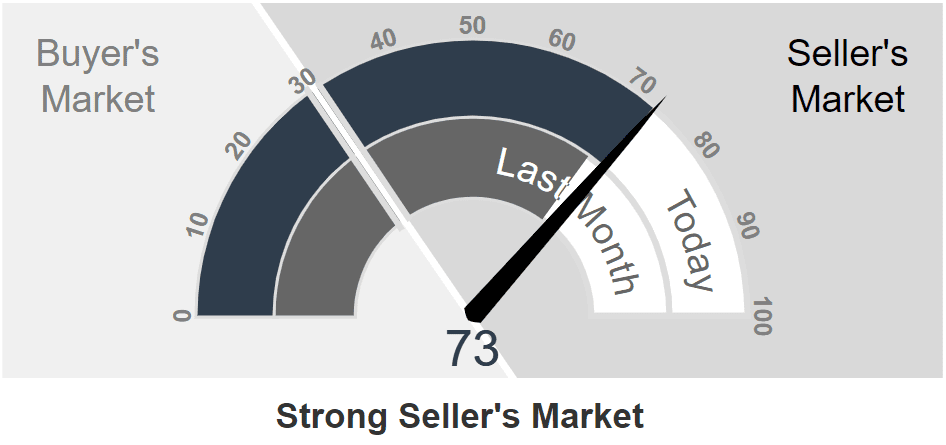
The Altos Research Market Action Index for single-family homes in Santa Clara has lowered to 73 from 77 where it was last month. For more detailed reports on Santa Clara and Santa Clara Zip codes, you can access the reports here.
Santa Clara Report
95051 Report
95050 Report
95054 Report
As I said earlier, inventory is typically lower at the beginning of the year. With COVID however, we are noticing less home owners wanting to move and sell. So expect low inventory to be in effect at least for the first half of the year.
The other factor that is contributing to the hot market are low interest rates and a very hot stock market.
In fact conditions right now for buying with the current rates and stock values are very good and the best they have been in years. We are noticing some markets that have already eclipsed their 2018 highs and are setting records.
We have not reached those 2018 price points yet but there is a good chance we may.
The other thing to watch out for is rising interest rates. Expect as COVID numbers decline interest rates will increase due to speculation in the bond market. The trend moving forward for the short term is that interest rates will be increasing.
And of course, there is Prop. 19 which will go into effect on April 1. For those of you that are unaware of Prop. 19, it will allow homeowners to move their existing property tax base to a new home anywhere in the state.
I am expecting this to have a big effect on local real estate, especially for retired homeowners looking to downsize.
As of yet however, it doesn’t seem to be motivation enough for home owners who are still concerned about moving during COVID.
Save thousands when you sell.
Includes Free Staging and Our Complete Selling Solution
* Total commission 4% including buyer side agent commission of 2.5%, offer varies by value of home.
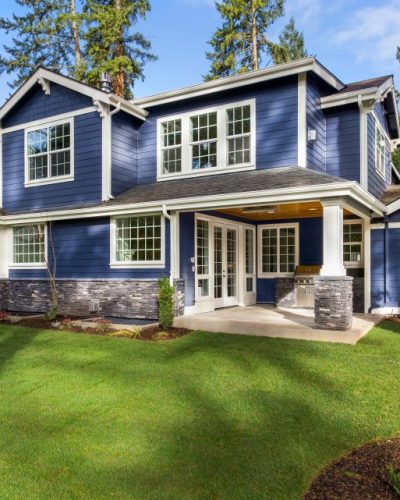
Buyers, if you are actively shopping right now then you know how hectic and competitive our current market is. As prices keep increasing it may seem as though you will be priced out of the market. It’s a very difficult situation for buyers and not one with an easy solution. Just understand that markets like these can not be sustained for a long time. As more inventory gets introduced competition will decrease, and eventually homes will be sitting on the market longer. My best advice for buyers is to stick to your plan, don’t compromise on your home, and buy in a poor or undesirable location.
Sellers, you couldn’t ask for a better market to be selling in. But chances are if your home isn’t on the market or planning to be on the market in the next few weeks you may miss this frenzy. The question moving forward is where will prices be in a few months, will prices hold up, or will there be a pullback such as the one experienced in the 2018 spring market.
As always, whether you are buying or selling be sure to understand how your property ranks in the current market. Knowing how your home or the home you are considering buying fits in the current market is important to determine the right price.
If you have any questions about a home on the market or your home’s value, please feel free to reach out I am happy to hear from you.
Contact Me Today
Have a question? Interested in setting an appointment to talk about your real estate plans? Contact me today.
-
VINICIUS BRASIL, Realtor
Keller Williams - The Brasil Group
19400 Stevens Creek Blvd #200
Cupertino, CA 95014 - 408.582.3272
- Schedule a meeting

Santa Clara January 2020 Home Sales
| Street Address | List Price | Price | DOM | Beds Total | Bths | Sq Ft Total | Age |
| 3139 Atherton Drive | $1,850,000 | $2,060,000 | 5 | 4 | 3|0 | 1,775 | 64 |
| 73 Brookside Avenue | $2,200,000 | $2,030,000 | 15 | 5 | 3|1 | 3,476 | 20 |
| 2602 Birchtree Lane | $1,998,800 | $1,998,800 | 106 | 5 | 3|0 | 2,583 | 50 |
| 3411 Forbes Avenue | $1,895,000 | $1,840,000 | 39 | 5 | 3|0 | 2,113 | 60 |
| 642 Briarcliff Court | $1,629,000 | $1,785,000 | 6 | 3 | 2|0 | 1,513 | 60 |
| 318 Los Padres Boulevard | $1,649,888 | $1,707,000 | 13 | 4 | 2|0 | 1,945 | 66 |
| 570 Hilmar Street | $1,488,000 | $1,575,000 | 1 | 3 | 1|1 | 1,708 | 85 |
| 738 Valley Court | $1,595,000 | $1,565,000 | 30 | 3 | 2|1 | 1,684 | 60 |
| 3585 Notre Dame Drive | $1,488,000 | $1,560,000 | 14 | 3 | 2|0 | 1,539 | 55 |
| 2230 Santa Cruz Avenue | $1,499,000 | $1,550,000 | 13 | 3 | 2|0 | 1,465 | 65 |
| 2495 Crystal Dr | $1,549,900 | $1,485,000 | 10 | 3 | 2|0 | 1,170 | 66 |
| 2459 Moraine Drive | $1,399,000 | $1,430,000 | 2 | 3 | 2|0 | 1,271 | 66 |
| 3058 Barkley Avenue | $1,398,000 | $1,400,000 | 22 | 3 | 2|0 | 1,170 | 63 |
| 1211 Foley Avenue | $1,400,000 | $1,388,000 | 11 | 3 | 2|0 | 1,275 | 64 |
| 429 California Street | $1,380,000 | $1,375,000 | 18 | 4 | 3|0 | 1,325 | 69 |
| 2092 Main Street | $1,195,000 | $1,288,888 | 7 | 3 | 2|0 | 1,500 | 66 |
| 2109 Quinn Avenue | $1,185,888 | $1,260,000 | 12 | 3 | 2|0 | 1,199 | 58 |
| 681 Kiely Boulevard | $1,225,000 | $1,251,000 | 7 | 3 | 2|0 | 1,145 | 65 |
| 3540 Benton Street | $1,249,000 | $1,226,000 | 83 | 3 | 2|0 | 1,166 | 66 |
| 621 Enright Avenue | $1,068,888 | $1,215,000 | 4 | 3 | 2|0 | 1,080 | 69 |
| 1161 Monroe Street | $1,220,000 | $1,155,000 | 93 | 3 | 2|0 | 1,512 | 100 |
| 1811 Main Street | $1,100,000 | $1,150,000 | 6 | 3 | 2|0 | 1,419 | 120 |
| 2055 Hogan Drive | $1,098,000 | $1,070,000 | 21 | 3 | 2|0 | 1,095 | 60 |
| 2395 Cimarron Drive | $1,050,000 | $1,050,000 | 0 | 4 | 2|0 | 1,288 | 53 |
Santa Clara Housing Market Archive
January 2020 home sales CLICK HERE.
December 2020 home sales CLICK HERE.
November 2020 home sales CLICK HERE.
October 2020 home sales CLICK HERE.
September 2020 home Sales CLICK HERE.
August 2020 home sales CLICK HERE.
July 2020 home sales CLICK HERE.
June 2020 home sales CLICK HERE.
May 2020 home sales CLICK HERE.
April 2020 home sales CLICK HERE.
March 2020 home sales CLICK HERE.
January 2020 home sales CLICK HERE.
