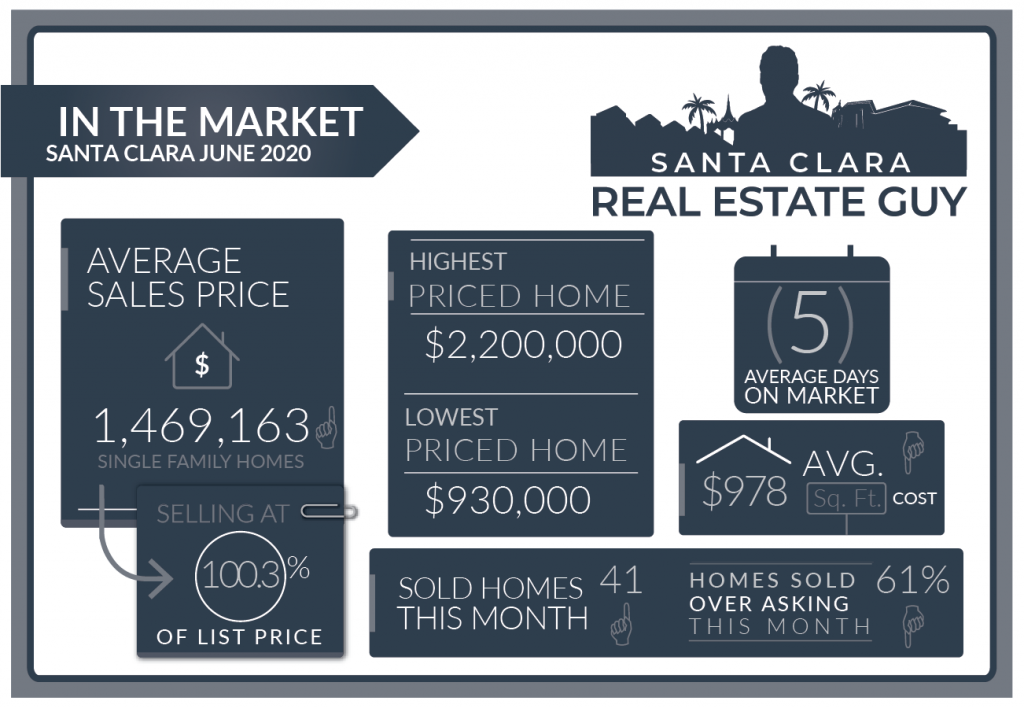
The Santa Clara housing market in June experienced 41 single-family homes that closed escrow, which was slightly more than the 40 which sold in May.
In June there were 50 homes that accepted contracts which was an increase from the prior month’s 39 homes. During that same period of time 46 homes were listed.
The average price of a home sold in June was $1.47M which is about $70K higher than last month’s figure of $1.4M. The Median price home sold was $1.4M, which is about $60K higher than May’s median price.
The average cost per square foot increased from $956 per Sq. Ft. to $984. Of the 41 homes sold in June, 25 sold over asking.
On average homes sold 0.34% over asking compared to 2.7% over asking in the previous month.
We started the month of June with 48 active single family home listings and finished with 50 in all of Santa Clara.May
June saw even more of a resurgence of real estate activity than May. As shelter in place restrictions were eased buyers took advantage of lower prices and very low-interest rates.
Last month we noticed more instances of multiple offers, and home values had rebounded a bit from low sales that were realized in the previous months.
The median price of a home sold was higher in June reversing a trend of the past two months of declining median price of sold homes.
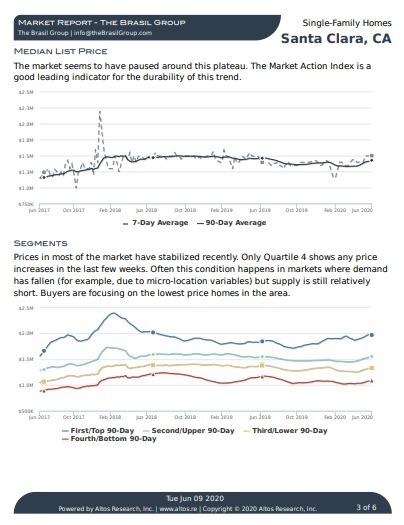
Altos Research Market Data For Santa Clara
This month the average price per sqft. dropped while median prices of home sold increased, signaling that larger more expensive homes were being sold.
Inventory continues to rise steadily but prices of homes sold are easing up. The Days on Market counter has been restored by the MLS, and more than half of the properties on the market have been listed for over 3 weeks.
So far there have been very few price reductions as sellers are staying firm and buyers are taking their time to find the right property.
Santa Clara Market Reports
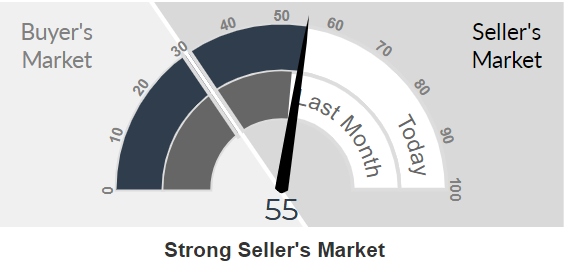
The Altos Research Market Action Index for single-family homes in Santa Clara has decreased to 55 from 62 where it was last month. For more detailed reports on Santa Clara and Santa Clara Zip codes, you can access the reports here.
Santa Clara Report
95051 Report
95050 Report
95054 Report
As the realization that the pandemic will likely extend into the middle of next year, homebuyers are motivated to get out of cramped apartments and into single-family homes.
Updated and remodeled homes, or homes in sought after neighborhoods seem to be getting lots of attention and offers. In some cases selling well over list price. Homes with undesirable locations or features are being ignored and passed over.
Now that shelter in place restrictions have been eased and protocols for home buying and selling are more defined and established, home sales have really picked up.
At the same time so have new listings. Homebuyers have not been able to keep up with the supply of homes, however, inventory levels have only gradually increased.
Buyers, the best decision you could ever make in real estate is to buy in a great location and neighborhood. Although these homes are selling quickly with multiple offers, the conditions for buying them are easier in this current market.
Continue to monitor inventory to see where the market may be headed. My guess is things should be softening up a bit in July as inventory increases.
Sellers, homes are selling, but not all of them. Some are sitting on the market and not getting any offers. If you are serious about selling your home you have to know the market for your home and what to expect.
As we move further into summer inventory will increase and conditions for selling shouldn’t get much better. If you need to sell, make sure to price your home accurately for the market otherwise, you may be in for a long sale.
If you have any questions about your home’s value or the current market, please feel free to reach out
Santa Clara Home Sales June 2020
| Street Address | List Price | Price | DOM | Beds Total | Bths | Sq Ft Total | Age |
| 2521 Brannan Place | $2,198,888 | $2,200,000 | 2 | 6 | 5|0 | 3,330 | 63 |
| 3075 Copper Place | $2,093,000 | $1,990,000 | 14 | 3 | 3|2 | 2,462 | 0 |
| 1023 Brackett Way | $1,948,888 | $1,980,000 | 0 | 4 | 2|1 | 2,331 | 17 |
| 510 Meadow Avenue | $1,898,000 | $1,930,000 | 1 | 3 | 2|0 | 1,504 | 61 |
| 1435 Lewis Street | $1,888,000 | $1,878,000 | 7 | 4 | 3|0 | 2,089 | 0 |
| 2819 Ponderosa Way | $1,795,000 | $1,840,000 | 0 | 4 | 2|1 | 1,810 | 60 |
| 507 Bancroft Street | $1,698,880 | $1,808,000 | 0 | 4 | 2|0 | 1,687 | 59 |
| 277 Kellogg Way | $1,850,000 | $1,805,000 | 13 | 3 | 2|0 | 1,388 | 62 |
| 114 Gilbert Avenue | $1,680,000 | $1,805,000 | 0 | 4 | 2|0 | 1,688 | 63 |
| 2632 Tuliptree Lane | $1,798,000 | $1,740,000 | 2 | 3 | 2|1 | 2,010 | 48 |
| 3326 Bellarmine Court | $1,500,000 | $1,630,000 | 0 | 4 | 2|0 | 1,631 | 64 |
| 1675 Cunningham Street | $1,599,000 | $1,600,000 | 0 | 4 | 2|1 | 2,141 | 69 |
| 2273 Pyle Court | $1,575,000 | $1,588,000 | 12 | 3 | 2|0 | 1,548 | 55 |
| 2357 Bohannon Drive | $1,549,000 | $1,575,000 | 0 | 4 | 2|0 | 1,675 | 68 |
| 3385 Kenyon Drive | $1,438,000 | $1,550,000 | 9 | 3 | 2|0 | 1,462 | 59 |
| 651 Hillsdale Avenue | $1,498,000 | $1,535,000 | 15 | 3 | 2|0 | 1,169 | 64 |
| 611 Woodhams Road | $1,329,000 | $1,500,000 | 8 | 3 | 2|0 | 1,206 | 59 |
| 780 Ridge Road | $1,499,000 | $1,482,000 | 4 | 4 | 2|0 | 1,310 | 65 |
| 2272 Cabrillo Avenue | $1,499,000 | $1,470,000 | 0 | 3 | 2|0 | 1,512 | 66 |
| 1675 Graham Lane | $1,375,000 | $1,400,000 | 7 | 3 | 2|0 | 1,563 | 70 |
| 2911 Jerald Avenue | $1,399,950 | $1,400,000 | 0 | 3 | 2|1 | 1,710 | 64 |
| 855 Monroe Street | $1,389,000 | $1,400,000 | 5 | 3 | 2|1 | 1,757 | 12 |
| 755 Orkney Avenue | $1,349,000 | $1,395,000 | 8 | 4 | 2|0 | 1,658 | 59 |
| 1014 Curtis Avenue | $1,290,000 | $1,370,000 | 4 | 3 | 2|0 | 1,166 | 66 |
| 2578 Elliot Court | $1,400,000 | $1,370,000 | 0 | 4 | 2|0 | 1,290 | 58 |
| 2585 Crystal Drive | $1,388,000 | $1,365,000 | 7 | 3 | 2|0 | 1,220 | 66 |
| 1130 Blackfield Drive | $1,350,000 | $1,300,000 | 3 | 3 | 2|0 | 1,484 | 65 |
| 2580 Dixon Drive | $1,274,999 | $1,270,000 | 0 | 3 | 2|0 | 1,166 | 65 |
| 3414 Victoria Avenue | $1,149,000 | $1,252,000 | 2 | 3 | 1|0 | 1,068 | 66 |
| 2439 Benton Street | $1,198,000 | $1,230,000 | 13 | 3 | 2|0 | 1,134 | 65 |
| 730 Salberg Avenue | $1,295,000 | $1,225,000 | 0 | 3 | 2|0 | 1,254 | 65 |
| 1 Alviso Street | $1,079,000 | $1,201,000 | 6 | 2 | 2|0 | 989 | 74 |
| 1055 Reed Street | $1,199,000 | $1,200,000 | 1 | 3 | 2|0 | 1,411 | 75 |
| 1373 Las Palmas Drive | $999,888 | $1,160,000 | 7 | 3 | 1|0 | 1,006 | 68 |
| 324 Madison | $1,198,000 | $1,157,500 | 5 | 3 | 1|0 | 1,384 | 82 |
| 2343 Arlene Drive | $1,575,000 | $1,080,000 | 18 | 3 | 2|1 | 1,815 | 68 |
| 745 Enright Avenue | $1,049,950 | $1,070,000 | 0 | 3 | 1|0 | 980 | 70 |
| 1141 Lafayette Street | $1,200,000 | $1,055,000 | 30 | 3 | 1|1 | 1,790 | 115 |
| 663 Park Court | $998,888 | $1,030,000 | 8 | 3 | 1|1 | 1,001 | 96 |
| 1481 Nelson Court | $1,199,888 | $930,000 | 2 | 4 | 2|0 | 1,527 | 60 |
Contact Me Today
Have a question? Interested in setting an appointment to talk about your real estate plans? Contact me today.
-
VINICIUS BRASIL, Realtor
Keller Williams - The Brasil Group
19400 Stevens Creek Blvd #200
Cupertino, CA 95014 - 408.582.3272
- Schedule a meeting
Santa Clara Housing Market Archive
June 2020 home sales CLICK HERE.
May 2020 home sales CLICK HERE.
April 2020 home sales CLICK HERE.
March 2020 home sales CLICK HERE.
January 2020 home sales CLICK HERE.
December 2019 home sales CLICK HERE.
November 2019 home sales CLICK HERE.
October 2019 home sales CLICK HERE.
September 2019 home sales CLICK HERE.
August 2019 home sales CLICK HERE.
July 2019 home sales CLICK HERE.
June 2019 home sales CLICK HERE.
May 2019 home sales CLICK HERE.
April 2019 home sales CLICK HERE.
March 2019 home sales CLICK HERE.
February 2019 home sales CLICK HERE.
January 2019 home sales CLICK HERE.
December 2018 home sales CLICK HERE.
November 2018 home sales CLICK HERE.
October 2018 home sales CLICK HERE.
September 2018 home sales CLICK HERE.
August 2018 home sales CLICK HERE.
July 2018 home sales CLICK HERE.
June 2018 home sales CLICK HERE.
May 2018 home sales CLICK HERE.
