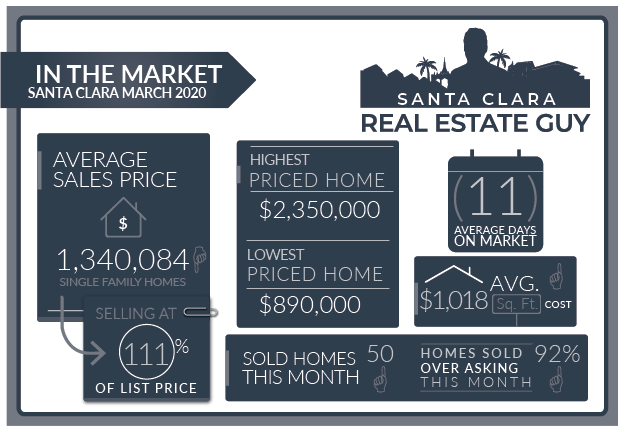
Here is a recap of the Santa Clara housing market in March. There were 50 single-family homes that closed escrow in March, which was more than the 18 which sold in February. The average days on market of those homes sold went to 11 days from 13 days the previous month, and median days decreased to 7 from 8.
The average price of a home sold in March 2020 was $1.34M which is about $120K lower than last month’s figure of $1.46M. The Median price home sold was $1.38M, which is about $60K lower than February’s median price.
The average cost per square foot increased from $979 per Sq. Ft. to $1,018. Of the 50 homes sold in March, 46 sold over asking. On average homes sold 11.2% over asking compared to 9.6% over asking in the previous month.
We started the month of March with just 10 active listings and finished with 25 in all of Santa Clara.

In March we experienced a rapid shift in the market. Fears of the spread of the Corona virus and forced governments to put in place shelter in place policies. The policies have shut down non-essential businesses which were first enacted by neighboring counties and then by the state. So how is this affecting the market in Santa Clara?
The reality is that some homes are still selling. We are noticing more cautious behavior from buyers in terms of offers, and less homes being listed due to shelter in place restrictions.
Just last week, real estate has been named an essential service in California and new policies regarding listings and showings have been put in place. As of today, there are 35 homes on the market in Santa Clara, which is low considering we are in April.
Many of these homes have been on the market for a few weeks. Although the MLS has stopped the days on market counter during the shelter in place period, its very clear that the market has slowed considerable.
Santa Clara Market Reports
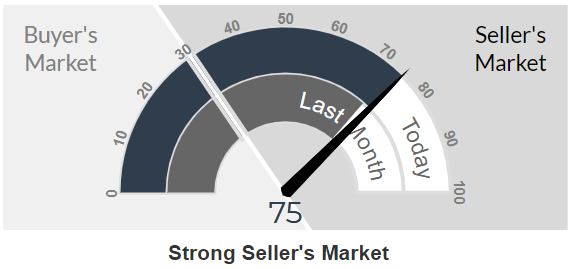
The Altos Research Market Action Index for single-family homes in Santa Clara has risen to 75 from 70 where it was last month. For more detailed reports on Santa Clara and Santa Clara Zip codes, you can access the reports here.
Santa Clara Report
95051 Report
95050 Report
95054 Report
Since March 1st 84 single family home were listed and of those 47 have sold and 8 were cancelled or pulled off the market.
The homes that are selling now are very desirable homes that are priced will. Homes that need work, in less desirable areas are having trouble selling.
I expect that inventory will continue to increase through out the Summer and put downward pressure on home values.
As a seller right now understand that the prospects moving forward for home values are not positive. I don’t expect dramatic drops, such as those that we experienced in the housing crisis (See Our Post on The Corona virus and Housing Market) but sellers who need to move are going to start dropping their prices to get their home’s sold.
Buyers, this is a good opportunity to buy a home in rare slow market. Not all sellers are going to feel the pressure to sell right now, some may opt to hold off until next year. By actively looking right now you are in a better position to find the right home than you would be in a competitive market.
Santa Clara Home Sales March 2020
| Street Address | List Price | Price | DOM | Beds Total | Bths | Sq Ft Total | Age |
| 2634 Maplewood Lane | $2,295,000 | $2,350,000 | 0 | 4 | 2|1 | 2,364 | 50 |
| 554 Flannery Street | $1,798,000 | $2,050,000 | 1 | 5 | 3|0 | 2,404 | 57 |
| 3215 Orthello Way | $1,490,000 | $2,000,000 | 8 | 5 | 2|0 | 2,544 | 70 |
| 132 Claremont Avenue | $1,559,000 | $1,950,000 | 8 | 3 | 2|0 | 1,292 | 64 |
| 2360 Raggio Avenue | $1,899,000 | $1,940,000 | 13 | 4 | 3|0 | 1,956 | 68 |
| 3191 James Court | $1,698,000 | $1,930,000 | 14 | 4 | 3|0 | 2,234 | 62 |
| 1044 Bluebird Avenue | $1,648,000 | $1,910,000 | 9 | 3 | 2|0 | 1,388 | 59 |
| 2842 Ramona Court | $1,598,888 | $1,902,000 | 8 | 3 | 3|0 | 1,998 | 65 |
| 653 Hudson Drive | $1,650,000 | $1,880,000 | 8 | 4 | 2|0 | 1,350 | 64 |
| 660 Meadow Avenue | $1,698,000 | $1,850,000 | 8 | 4 | 2|0 | 1,430 | 61 |
| 3555 Mauricia Avenue | $1,488,888 | $1,800,000 | 9 | 3 | 1|1 | 1,285 | 61 |
| 2946 Taper Avenue | $1,599,000 | $1,700,000 | 6 | 3 | 4|0 | 1,819 | 63 |
| 837 Cherry Orchard Place | $1,549,000 | $1,680,000 | 7 | 4 | 3|0 | 1,935 | 12 |
| 2049 Finley Place | $1,349,000 | $1,650,000 | 7 | 4 | 2|1 | 1,902 | 20 |
| 1918 Woodland Avenue | $1,450,000 | $1,615,000 | 10 | 4 | 2|0 | 1,996 | 64 |
| 3159 Butte Street | $1,399,950 | $1,600,000 | 22 | 3 | 1|0 | 1,398 | 72 |
| 2163 Dianne Drive | $1,449,000 | $1,575,000 | 11 | 3 | 2|0 | 1,529 | 59 |
| 2759 Rebeiro Avenue | $1,399,000 | $1,570,000 | 6 | 3 | 2|0 | 1,305 | 65 |
| 2379 Menzel Place | $1,350,000 | $1,550,888 | 5 | 5 | 2|0 | 2,057 | 68 |
| 2180 Monterey Avenue | $1,328,000 | $1,550,000 | 3 | 3 | 2|0 | 1,341 | 65 |
| 1885 Bowers Avenue | $1,399,800 | $1,550,000 | 9 | 4 | 2|0 | 1,330 | 64 |
| 2142 Payne Place | $1,450,000 | $1,550,000 | 9 | 3 | 2|1 | 2,000 | 13 |
| 2662 Forbes Avenue | $1,350,000 | $1,530,000 | 7 | 3 | 2|0 | 1,166 | 66 |
| 2612 Wallace Street | $1,398,000 | $1,500,000 | 0 | 3 | 1|0 | 1,351 | 64 |
| 1791 Columbus Place | $1,399,888 | $1,485,000 | 11 | 3 | 2|0 | 1,192 | 64 |
| 1026 Sunset Drive | $1,350,000 | $1,478,888 | 0 | 4 | 2|0 | 1,495 | 70 |
| 2149 Calabazas Boulevard | $1,275,000 | $1,450,000 | 7 | 3 | 2|0 | 1,078 | 65 |
| 2321 Rosita Avenue | $1,280,000 | $1,420,000 | 7 | 3 | 2|0 | 1,140 | 65 |
| 2210 Consuelo Avenue | $1,300,000 | $1,390,000 | 9 | 3 | 1|0 | 1,507 | 68 |
| 124 Cypress Avenue | $1,099,950 | $1,390,000 | 7 | 3 | 1|1 | 1,409 | 69 |
| 1346 Monroe Street | $1,400,000 | $1,380,000 | 8 | 4 | 2|1 | 1,989 | 25 |
| 205 Bret Harte Court | $1,198,000 | $1,376,000 | 8 | 4 | 2|0 | 1,363 | 65 |
| 3379 Saint Marys Place | $1,350,000 | $1,336,500 | 8 | 3 | 2|0 | 1,328 | 63 |
| 3523 Macintosh Street | $1,088,000 | $1,331,000 | 4 | 3 | 2|0 | 1,207 | 59 |
| 2805 Barcells Avenue | $1,100,000 | $1,331,000 | 6 | 3 | 2|0 | 1,254 | 65 |
| 738 Flannery Street | $1,099,950 | $1,320,000 | 6 | 3 | 2|0 | 1,108 | 65 |
| 1394 Jackson Street | $1,098,000 | $1,257,000 | 7 | 3 | 2|0 | 1,470 | 100 |
| 2155 Esperanca Avenue | $1,098,888 | $1,220,000 | 9 | 3 | 2|1 | 1,351 | 21 |
| 2311 Pruneridge Avenue | $1,100,000 | $1,200,000 | 1 | 3 | 2|0 | 1,297 | 65 |
| 2840 Monroe Street | $950,888 | $1,120,000 | 0 | 4 | 2|0 | 1,158 | 60 |
| 2567 Pilot Knob Drive | $928,000 | $1,120,000 | 10 | 3 | 1|0 | 1,162 | 66 |
| 2025 Jackson | $988,000 | $1,100,000 | 10 | 3 | 2|0 | 1,033 | 66 |
| 1338 Lafayette Street | $1,119,000 | $1,090,000 | 141 | 3 | 2|0 | 1,206 | 99 |
| 2495 Crystal Drive | $999,950 | $1,050,000 | 10 | 3 | 1|0 | 1,174 | 65 |
| 2107 Monroe Street | $998,000 | $1,030,000 | 21 | 3 | 1|0 | 985 | 66 |
| 1224 Sherwood Avenue | $1,000,000 | $1,000,000 | 0 | 2 | 1|0 | 744 | 27 |
| 1922 Main Street | $799,888 | $980,000 | 7 | 3 | 1|0 | 1,044 | 72 |
| 1335 Monroe Street | $834,900 | $957,000 | 10 | 2 | 1|0 | 910 | 72 |
| 4435 Fillmore Street | $929,000 | $940,000 | 8 | 2 | 1|0 | 924 | 58 |
| 1631 Cabrillo Avenue | $849,000 | $890,000 | 3 | 3 | 1|0 | 985 | 66 |
Contact Me Today
Have a question? Interested in setting an appointment to talk about your real estate plans? Contact me today.
-
VINICIUS BRASIL, Realtor
Keller Williams - The Brasil Group
19400 Stevens Creek Blvd #200
Cupertino, CA 95014 - 408.582.3272
- Schedule a meeting
Santa Clara Housing Market Archive
March 2020 home sales CLICK HERE.
January 2020 home sales CLICK HERE.
December 2019 home sales CLICK HERE.
November 2019 home sales CLICK HERE.
October 2019 home sales CLICK HERE.
September 2019 home sales CLICK HERE.
August 2019 home sales CLICK HERE.
July 2019 home sales CLICK HERE.
June 2019 home sales CLICK HERE.
May 2019 home sales CLICK HERE.
April 2019 home sales CLICK HERE.
March 2019 home sales CLICK HERE.
February 2019 home sales CLICK HERE.
January 2019 home sales CLICK HERE.
December 2018 home sales CLICK HERE.
November 2018 home sales CLICK HERE.
October 2018 home sales CLICK HERE.
September 2018 home sales CLICK HERE.
August 2018 home sales CLICK HERE.
July 2018 home sales CLICK HERE.
June 2018 home sales CLICK HERE.
May 2018 home sales CLICK HERE.


