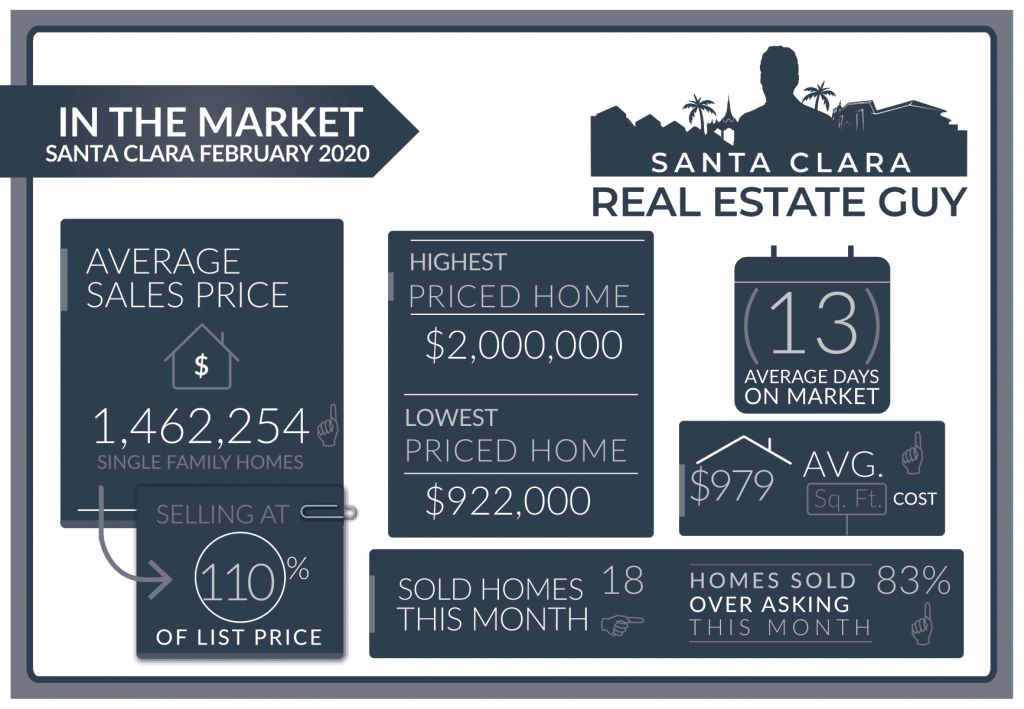
The Santa Clara housing market was strong in February. There were 18 single-family homes that closed escrow which was equal to the number which sold in January. The average days on market of those homes sold went to 13 days from 43 days the previous month, and median days decreased to 8 from 16.
The average price of a home sold in February 2020 was $1.46M which is about $70K higher than last month’s figure of $1.39M. The Median price home sold was $1.44M, which is about $36K higher than January’s median price.
The average cost per square foot increased from $859 per sqft. to $979. Of the 18 homes sold in February, 15 sold over asking. On average homes sold 9.6% over asking compared to 0.3% under asking in the previous month. That’s a huge increase.
We started the month of February with 16 active listings and finished with just 10 active listings in all of Santa Clara.

February housing prices in Santa Clara shot up high and fast. Home prices had climbed between $100K to $200K from December. Low inventory, low-interest rates, and a robust stock market motivated buyers.
In March, fears over the Coronavirus spreading and precautions to contain it rattled the stock market. The FED was so concerned over the slowing of the economy and a possible recession that it cut rates 50 basis points. In spite of the drastic move the markets still continued to sell-off ultimately dropping 30% from their highs.
As the country and local governments scramble to take precautions against the virus, schools have announced closures, bans have been placed on gatherings, and uncertainty over the effects of these measures is weighing in on buyers and sellers.
While homes are still selling we are noticing more cautious behavior from buyers and inventory is starting to grow. As of today, there are 36 homes on the market in Santa Clara which is considerably higher than the 10 homes we had at the end of February.
Santa Clara Market Reports
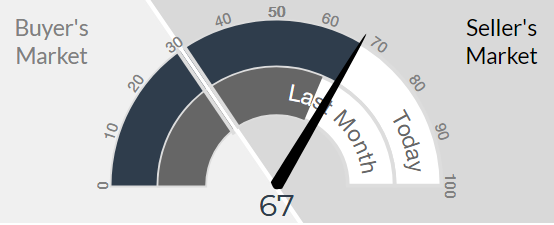
The Altos Research Market Action Index for single-family homes in Santa Clara has risen to 70 from 67 where it was last month. For more detailed reports on Santa Clara and Santa Clara Zip codes, you can access the reports here.
Santa Clara Report
95051 Report
95050 Report
95054 Report
As we move into the Spring we typically see more inventory come on and the market slows. With more homes brings more competition to home sellers and less offers. With the recent developments and the looming uncertainly I expect the market will cool faster and home inventory will rise quicker.
Sellers are likely to push up their list dates to avoid the crowding of the summer market bringing on more homes. There is still the possibility of what actions the FED will take to restore confidence and perhaps drop rates further, this may help keep prices stabilized.
For buyers, it’s hard to tell if buying conditions will be better in the Summer. Inventory may dry up due to the virus as sellers take homes off the market.
Seller’s expect less offers and not as much bidding as competition increases and homes take a bit longer to sell.
Santa Clara Home Sales February 2020
| Street Address | List Price | Sales Price | DOM | Beds Total | Bths | Sq Ft Total | Age |
| 4330 Rivermark Parkway | $1,899,800 | $2,000,000 | 6 | 4 | 2|1 | 2,331 | 17 |
| 4521 Billings Circle | $1,948,000 | $1,930,000 | 0 | 4 | 3|1 | 2,408 | 16 |
| 775 Cornell Drive | $1,495,000 | $1,775,000 | 13 | 3 | 1|1 | 1,822 | 65 |
| 2895 Stevenson Street | $1,399,000 | $1,765,000 | 7 | 3 | 2|1 | 1,684 | 60 |
| 72 Brian Lane | $1,600,000 | $1,700,000 | 3 | 3 | 2|0 | 1,432 | 63 |
| 949 Capitola Way | $1,395,000 | $1,675,000 | 8 | 4 | 2|0 | 1,845 | 56 |
| 3160 Fowler Avenue | $1,375,000 | $1,500,000 | 13 | 3 | 2|0 | 1,375 | 66 |
| 3365 Georgetown Place | $1,288,800 | $1,455,000 | 5 | 3 | 2|0 | 1,414 | 62 |
| 23 Conner Place | $1,440,000 | $1,440,000 | 0 | 3 | 2|1 | 1,784 | 7 |
| 2325 Thompson Place | $1,399,000 | $1,430,000 | 117 | 4 | 2|0 | 1,669 | 69 |
| 2377 Roosevelt Circle | $1,198,000 | $1,370,000 | 0 | 3 | 2|0 | 1,254 | 52 |
| 2191 Santa Cruz Avenue | $1,195,000 | $1,358,000 | 8 | 3 | 2|0 | 1,078 | 65 |
| 656 Flannery Street | $1,295,000 | $1,330,000 | 15 | 4 | 2|0 | 1,127 | 67 |
| 3585 Rowena Court | $1,099,000 | $1,234,567 | 8 | 3 | 2|0 | 1,500 | 59 |
| 1335 Don Avenue | $1,149,880 | $1,216,000 | 8 | 3 | 1|0 | 985 | 66 |
| 2324 Park Avenue | $988,000 | $1,190,000 | 7 | 3 | 2|1 | 1,622 | 43 |
| 2058 Monroe Street | $998,880 | $1,030,000 | 10 | 3 | 1|0 | 1,273 | 66 |
| 663 Park Court | $922,000 | $922,000 | 0 | 3 | 1|1 | 1,001 | 96 |
January 2020 home sales CLICK HERE.
December 2019 home sales CLICK HERE.
November 2019 home sales CLICK HERE.
October 2019 home sales CLICK HERE.
September 2019 home sales CLICK HERE.
August 2019 home sales CLICK HERE.
July 2019 home sales CLICK HERE.
June 2019 home sales CLICK HERE.
May 2019 home sales CLICK HERE.
April 2019 home sales CLICK HERE.
March 2019 home sales CLICK HERE.
February 2019 home sales CLICK HERE.
January 2019 home sales CLICK HERE.
December 2018 home sales CLICK HERE.
November 2018 home sales CLICK HERE.
October 2018 home sales CLICK HERE.
September 2018 home sales CLICK HERE.
August 2018 home sales CLICK HERE.
July 2018 home sales CLICK HERE.
June 2018 home sales CLICK HERE.
May 2018 home sales CLICK HERE.
Contact Us Today!!!
Lorem ipsum dolor sit amet, consectetur adipiscing elit. Ut elit tellus, luctus nec ullamcorper mattis, pulvinar dapibus leo.


