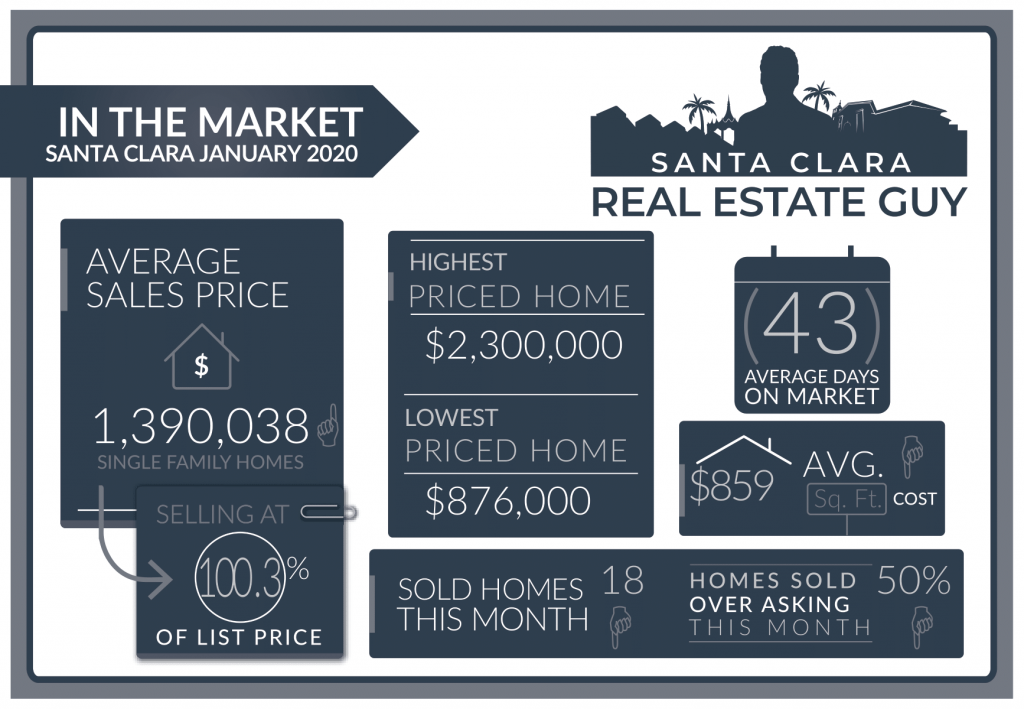
2020 January home sales in Santa Clara consisted of 18 single-family homes that closed escrow, a decrease from the 39 homes sold in December. The average days on market of those homes sold were 43 days from 23 days the previous month, and median days increased to 16 from 13.
The average price of a home sold in January 2019 was $1.39M which is about $10K higher than last month’s figure of $1.38M. The Median price home sold was $1.4M, which is almost equivalent to December’s median price.
The average cost per square foot decreased from $899 per sqft. to $859. Of the 18 homes sold in January, 9 sold over asking. On average homes sold 0.3% over asking compared to -2.1% under asking in the previous month.
We started the month of January with 5 active listings and finished with just 16 active listings in all of Santa Clara.

Just like in most cases the statistics are behind what’s currently going on in the market and not telling the full story. The average days on market of sold homes increased substantially because many homes that were just sitting on the market were finally sold due to the ever heating market.
The low inventory, low-interest rates, and the record-breaking stock market are all contributing to the strong sellers market. Currently, we are seeing multiple offers on most listings, and homes selling $100K of dollars over what they would have sold just a month prior.
Inventory continues to remain low as the rate of new listings can’t keep up with buyer demand. Open houses in the last few weeks have been crowded and buyers can’t help but notice that the market has dramatically shifted.
Santa Clara Market Reports
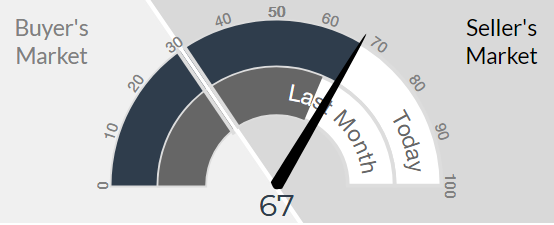
The Altos Research Market Action Index for single-family homes in Santa Clara has risen to 67 from 66 where it was last month. For more detailed reports on Santa Clara and Santa Clara Zip codes, you can access the reports here.
Santa Clara Report
95051 Report
95050 Report
95054 Report
We are noticing similar conditions to what happened in 2018 when the market topped in mid to late spring. Prices have risen sharply in the last two months, primarily in January but those sales won’t be public until later this month.
In the meantime, sellers who want to take advantage of this market should start to make plans to sell now before late spring and early summer. In the last two years, the market has stalled around this time. What’s different this year is that interest rates are lower and will likely remain low for the foreseeable future.
Also, there is the uncertainty of the looming election and its effect on the stock market.
As prices rise, buyers, either drop out of the market and hope for things to cool down or get more serious about their offers. In the meantime, prices will likely continue to go up, and there are no indicators of when prices will stabilize or drop.
As more inventory gets introduced to the market the rate of price increases should slow down, but there needs to be a substantial increase in inventory before the market flattens. The best advice I can give to buyers is to be careful not to make poor buying decisions. Even if you overpay for a good home in a good location its better than getting a deal on a bad home in a bad location.
Santa Clara Home Sales January 2020
| Street Address | List Price | Sales Price | DOM | Beds Total | Baths | Sq Ft Total | Age |
| 2819 Toyon Drive | $2,195,000 | $2,300,000 | 5 | 4 | 2|1 | 2,362 | 44 |
| 2935 Aspen Drive | $1,500,000 | $1,700,000 | 13 | 4 | 2|1 | 1,810 | 56 |
| 4121 Tobin Circle | $1,548,000 | $1,695,000 | 8 | 3 | 2|1 | 2,036 | 16 |
| 1267 Lafayette Street | $1,750,000 | $1,600,000 | 20 | 4 | 3|0 | 2,206 | 99 |
| 2282 Lenox Place | $1,559,000 | $1,530,000 | 73 | 4 | 3|0 | 2,223 | 21 |
| 746 Armanini Avenue | $1,468,000 | $1,435,000 | 21 | 3 | 2|0 | 1,332 | 69 |
| 3477 Forbes Avenue | $1,399,000 | $1,425,000 | 2 | 3 | 2|0 | 1,379 | 59 |
| 2982 Howell Avenue | $1,250,000 | $1,420,000 | 12 | 3 | 2|0 | 1,329 | 63 |
| 2065 Warburton Avenue | $1,450,000 | $1,411,800 | 85 | 3 | 2|0 | 1,693 | 68 |
| 1610 Long Street | $1,349,000 | $1,385,000 | 73 | 5 | 3|0 | 1,872 | 48 |
| 2591 Monroe Street | $1,375,000 | $1,375,000 | 191 | 3 | 2|0 | 1,685 | 47 |
| 391 Kohner Court | $1,348,000 | $1,310,000 | 75 | 4 | 1|1 | 1,579 | 66 |
| 1464 Homestead Road | $1,300,000 | $1,260,000 | 134 | 5 | 4|1 | 3,094 | 37 |
| 2144 Talia Avenue | $1,100,000 | $1,175,000 | 5 | 2 | 1|0 | 1,123 | 68 |
| 656 Malarin Avenue | $1,299,000 | $1,130,000 | 1 | 4 | 2|0 | 1,376 | 69 |
| 3605 Eastwood Circle | $1,265,000 | $1,010,000 | 30 | 4 | 2|0 | 1,565 | 52 |
| 826 Baird Avenue | $949,900 | $982,888 | 12 | 3 | 2|0 | 1,097 | 58 |
| 1687 Bellomy Street | $849,000 | $876,000 | 8 | 1 | 1|0 | 800 | 82 |
December 2019 home sales CLICK HERE.
November 2019 home sales CLICK HERE.
October 2019 home sales CLICK HERE.
September 2019 home sales CLICK HERE.
August 2019 home sales CLICK HERE.
July 2019 home sales CLICK HERE.
June 2019 home sales CLICK HERE.
May 2019 home sales CLICK HERE.
April 2019 home sales CLICK HERE.
March 2019 home sales CLICK HERE.
February 2019 home sales CLICK HERE.
January 2019 home sales CLICK HERE.
December 2018 home sales CLICK HERE.
November 2018 home sales CLICK HERE.
October 2018 home sales CLICK HERE.
September 2018 home sales CLICK HERE.
August 2018 home sales CLICK HERE.
July 2018 home sales CLICK HERE.
June 2018 home sales CLICK HERE.
May 2018 home sales CLICK HERE.
Check out your home’s current value online, quick and free with our new Santa Clara Home Valuation Tool.
http://MySantaClaraHome.com
Get a Detailed Report with all the Sales in your Neighborhood.
Contact Us Today!!!
Lorem ipsum dolor sit amet, consectetur adipiscing elit. Ut elit tellus, luctus nec ullamcorper mattis, pulvinar dapibus leo.


