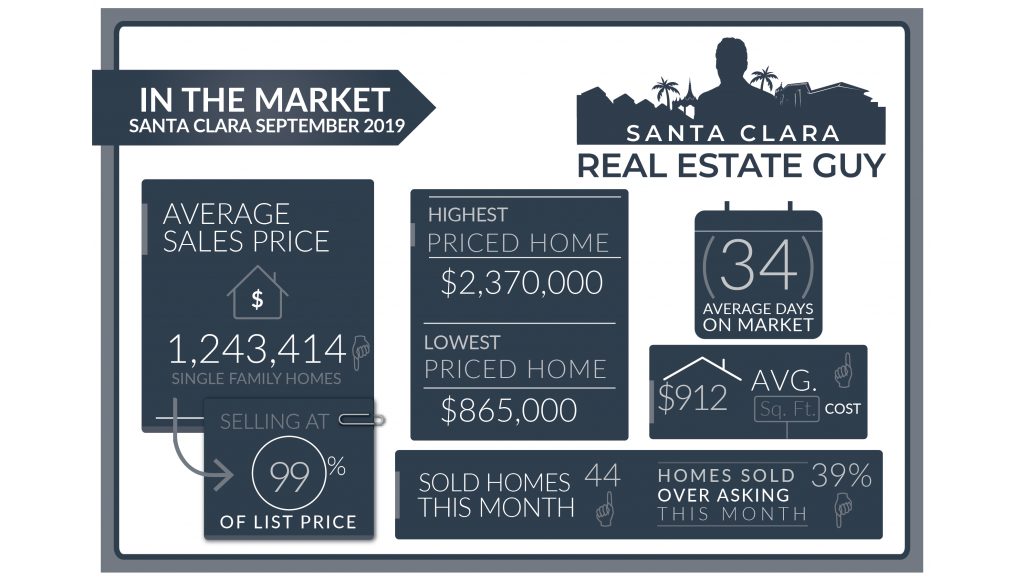
2019 September home sales in Santa Clara consisted of 44 single-family homes that closed escrow, a slight increase from the 43 homes sold in August. Average days on market increased to 34 days from 29 days, and median days increased to 17 from 15. The average price of a home sold in September 2019 was $1.24M which is about $130K lower than last month’s figure of $1.37M.
The Median price home sold was $1.24M, which is about $60K lower than August’s median price. The average cost per square foot increased from $827 per sqft. to $912. Of the 44 homes sold in August, 17 sold over asking. On average homes sold -1% under asking compared to +0.8% over asking in the previous month.

We are experiencing an interesting market. Inventory has dropped and sales have dropped, interest rates are also very low, but prices continue to settle lower. Our current market is demonstrating that buyers are being very patient in their home-buying decisions, and motivated sellers are dropping their prices to entice offers
September was the first month a number of years that homes sold on average less than their list price. The Summer market we just experienced was exceptionally slow. When September hit we noticed that inventory increased slightly but then started to fall later in the month.
In late September we started to see homes that had been sitting on the market finally get into contract. What we were experiencing in late September and in the current month of October is a tightening of the market. Where inventory is dropping, in this case due to heightened buying activity and slower listing activity.
With the FED worried about the economic slow down they have started to lower rates and that has contributed to a hotter market. Although the last few months we had experienced dropping home values, I expect the market to stabilize and even price increases as we move into the holidays.
Santa Clara Home Sales September 2019
| Street Address | List Price | Price | DOM | Beds Total | Bths | Sq Ft Total | Age |
| 104 Michael Way | $1,450,000 | $1,650,000 | 14 | 3 | 2|0 | 1,274 | 64 |
| 1795 Roll Street | $1,389,000 | $1,270,000 | 65 | 3 | 2|0 | 1,694 | 68 |
| 4496 Lakeshore Drive | $1,388,888 | $1,300,000 | 62 | 3 | 2|0 | 1,962 | 42 |
| 3519 Haig Street | $949,000 | $930,000 | 17 | 3 | 2|0 | 1,097 | 58 |
| 2175 Hoover Drive | $1,200,000 | $1,210,000 | 13 | 3 | 2|0 | 1,181 | 56 |
| 2381 Donner Place | $1,295,000 | $1,235,000 | 38 | 4 | 2|0 | 1,350 | 64 |
| 3458 Bella Vista Avenue | $1,199,850 | $1,200,000 | 8 | 3 | 2|0 | 1,212 | 65 |
| 2939 Marietta Drive | $1,488,000 | $1,465,000 | 59 | 3 | 3|0 | 1,641 | 61 |
| 3225 Machado Avenue | $1,338,000 | $1,313,800 | 42 | 3 | 2|0 | 1,078 | 64 |
| 2205 Menzel Place | $1,200,000 | $1,210,000 | 9 | 3 | 2|0 | 1,400 | 65 |
| 1420 Bellomy Street | $899,000 | $865,000 | 51 | 2 | 2|0 | 820 | 139 |
| 3596 Rowena Court | $999,998 | $925,000 | 188 | 3 | 1|0 | 1,008 | 58 |
| 2562 Scanlan Place | $1,245,000 | $1,250,000 | 6 | 3 | 2|0 | 1,340 | 62 |
| 2139 3rd Street | $1,199,999 | $1,136,000 | 122 | 3 | 2|1 | 1,589 | 19 |
| 3361 Granada Court | $1,248,000 | $1,230,000 | 21 | 3 | 2|0 | 1,166 | 65 |
| 1134 Monroe Street | $888,888 | $930,000 | 8 | 2 | 2|1 | 1,126 | 32 |
| 1421 Bergin Place | $1,299,000 | $1,250,000 | 113 | 3 | 2|0 | 1,375 | 65 |
| 2063 Pruneridge Avenue | $998,000 | $945,000 | 13 | 3 | 1|0 | 1,016 | 65 |
| 2133 Pruneridge Avenue | $1,090,000 | $1,100,000 | 12 | 3 | 1|0 | 1,016 | 65 |
| 2318 Stanford Place | $1,688,000 | $1,638,000 | 48 | 3 | 2|0 | 2,002 | 62 |
| 2244 Emmett Court | $1,428,000 | $1,410,000 | 16 | 3 | 2|0 | 1,368 | 62 |
| 2476 Armstrong Place | $1,199,950 | $1,237,000 | 1 | 3 | 2|0 | 1,170 | 64 |
| 1953 Murguia Avenue | $1,498,880 | $1,550,000 | 7 | 3 | 2|0 | 1,876 | 72 |
| 1905 Morse Street | $850,000 | $900,000 | 5 | 2 | 1|0 | 872 | 78 |
| 673 Bucher Avenue | $1,398,800 | $1,361,100 | 28 | 3 | 2|0 | 1,230 | 65 |
| 930 Wren Avenue | $1,888,888 | $1,765,888 | 18 | 4 | 2|1 | 2,140 | 25 |
| 1669 Berna Street | $1,199,000 | $1,240,000 | 5 | 2 | 2|0 | 1,524 | 24 |
| 3218 Agate Drive | $1,117,777 | $1,060,000 | 88 | 3 | 2|0 | 897 | 64 |
| 2514 Hayward Drive | $1,289,000 | $1,310,000 | 20 | 3 | 2|0 | 1,166 | 64 |
| 4288 Macedo Place | $998,000 | $985,000 | 17 | 3 | 2|1 | 1,199 | 18 |
| 2694 Maplewood Lane | $2,395,000 | $2,370,000 | 43 | 5 | 3|0 | 3,133 | 49 |
| 511 Bellwood Drive | $1,495,000 | $1,480,000 | 8 | 6 | 3|0 | 2,248 | 54 |
| 3487 San Marcos Way | $1,200,000 | $1,150,000 | 22 | 3 | 1|0 | 1,097 | 64 |
| 577 Woodstock Way | $1,249,000 | $1,325,000 | 8 | 3 | 2|0 | 1,888 | 52 |
| 2237 3rd Street | $1,249,000 | $1,245,000 | 55 | 4 | 2|1 | 1,705 | 19 |
| 4706 Wilcox Avenue | $1,169,000 | $1,157,000 | 105 | 3 | 2|1 | 1,599 | 21 |
| 3187 San Juan Avenue | $1,188,000 | $1,258,000 | 7 | 3 | 2|0 | 1,095 | 61 |
| 930 Monroe Street | $1,600,000 | $1,730,000 | 0 | 3 | 1|1 | 2,667 | 113 |
| 670 Bucher Avenue | $1,350,000 | $1,300,000 | 14 | 3 | 2|0 | 1,230 | 65 |
| 3487 Victoria Avenue | $1,099,000 | $1,120,000 | 11 | 3 | 2|0 | 1,080 | 65 |
| 1037 Harrison Street | $849,900 | $930,000 | 30 | 2 | 1|0 | 1,274 | 119 |
| 2338 Vargas Place | $1,025,000 | $915,000 | 11 | 3 | 2|0 | 1,053 | 65 |
| 2112 Monroe Street | $1,025,000 | $1,025,000 | 2 | 4 | 1|0 | 1,385 | 65 |
| 3426 Flora Vista Avenue | $1,300,000 | $1,240,000 | 35 | 3 | 2|0 | 1,080 | 65 |
See Previous Months
August 2019 home sales CLICK HERE.
July 2019 home sales CLICK HERE.
June 2019 home sales CLICK HERE.
May 2019 home sales CLICK HERE.
April 2019 home sales CLICK HERE.
March 2019 home sales CLICK HERE.
February 2019 home sales CLICK HERE.
January 2019 home sales CLICK HERE.
December 2018 home sales CLICK HERE.
November 2018 home sales CLICK HERE.
October 2018 home sales CLICK HERE.
September 2018 home sales CLICK HERE.
August 2018 home sales CLICK HERE.
July 2018 home sales CLICK HERE.
June 2018 home sales CLICK HERE.
May 2018 home sales CLICK HERE.
Check out your home’s current value online, quick and free with our new Santa Clara Home Valuation Tool.
http://MySantaClaraHome.com
Get a Detailed Report with all the Sales in your Neighborhood.


