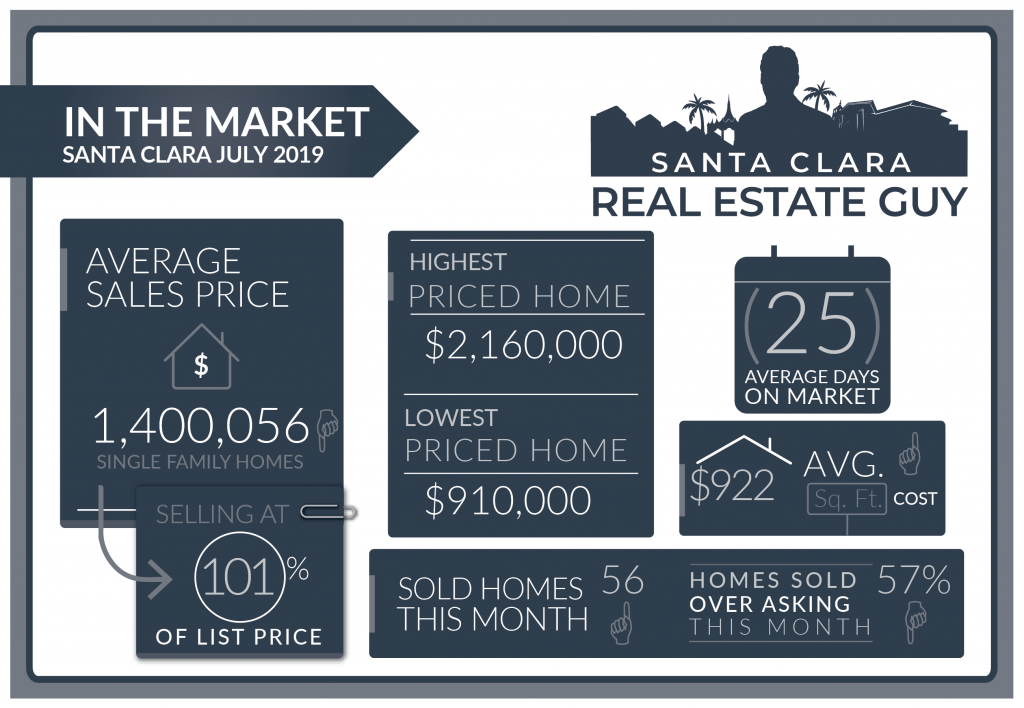
2019 July home sales in Santa Clara consisted of 56 single-family homes that closed escrow, an increase from the 46 homes sold in June. Average days on market increased to 25 days from 19 days, and median days increased to 14 from 10. The average price of a home sold in June 2019 was $1.4M which is about $20K lower than last month’s figure of $1.42M.
The Median price home sold was $1.36M, which is about $30K lower than June’s median price. The average cost per square foot increased from $887 per sqft. to $922. Of the 56 homes sold in July, 32 sold over asking. On average 1.2% over asking compared to 3.8% over asking in the previous month.

The market picked up a bit in July with more home sales. Together with the slow listing activity, our current market is experiencing lower inventory than the Spring market. Although market inventory is tightening in Santa Clara which is a common theme we see in August, buyers are still being very patient. Homes are sitting on the market longer, and price reductions are a weekly occurrence. We began July with 83 homes on the market in all of Santa Clara and ended with 68 homes at the beginning of August.
The lower inventory and perhaps the FED’s decision to drop rates have helped some homes that were just sitting on the market go to pending status.
Last year in August we saw a similar situation where inventory dropped, and that helped some homes sell. Last years August inventory was still about 20 homes less than August of 2019. Keep in mind we saw an influx of homes come on the market in early September when pushed down prices in the winter.
For sellers, you definitely want to make your home stand out from the crowded field of homes. Staging and the right updates can go a long way. Keep in mind that you don’t want to be delaying your home sale for too long as prices may continue to settle down.
Buyers, the conditions for buying are better than they have been in the last two years. Interest rates are the lowest they have been since 2016. No one is absolutely sure where the market is headed, but as we approach the Fall inventory levels should provide a good selection of homes before the slower Winter months.
| Street Address | List Price | Price | DOM | Beds Total | Bths | Sq Ft Total | Age |
| 2344 Arguello Place | $1,298,000 | $1,300,000 | 20 | 3 | 2|0 | 1,488 | 69 |
| 4949 Avenida De Los Arboles | $1,198,888 | $1,230,000 | 9 | 4 | 2|0 | 1,584 | 43 |
| 2439 Benton Street | $998,000 | $1,040,000 | 17 | 3 | 2|0 | 1,134 | 64 |
| 4427 Billings Circle | $1,999,000 | $2,020,000 | 14 | 4 | 3|1 | 2,408 | 15 |
| 151 Blake Avenue | $1,498,880 | $1,605,000 | 7 | 3 | 2|0 | 1,155 | 64 |
| 1953 Bohannon Drive | $1,488,000 | $1,590,000 | 8 | 3 | 2|0 | 1,631 | 67 |
| 3451 Bonita Avenue | $1,248,000 | $1,370,000 | 7 | 3 | 2|0 | 1,240 | 63 |
| 1022 Brackett Way | $1,999,800 | $2,010,000 | 8 | 4 | 3|1 | 2,408 | 16 |
| 641 Briarcliff Court | $1,598,000 | $1,598,000 | 48 | 4 | 3|0 | 1,934 | 58 |
| 4338 Burdick Lane | $2,188,000 | $2,160,000 | 31 | 4 | 3|1 | 2,989 | 15 |
| 3511 Butcher Drive | $1,348,000 | $1,338,000 | 11 | 3 | 2|0 | 1,463 | 65 |
| 1497 Cabrillo Avenue | $1,149,000 | $1,140,000 | 25 | 3 | 1|0 | 985 | 65 |
| 1632 Cabrillo Avenue | $1,350,000 | $1,390,000 | 9 | 3 | 2|0 | 1,794 | 65 |
| 2161 Calle De Primavera | $1,489,000 | $1,489,000 | 29 | 6 | 4|0 | 2,438 | 43 |
| 3360 Cecil Avenue | $1,275,000 | $1,250,000 | 9 | 3 | 2|0 | 1,320 | 68 |
| 3379 Creighton Place | $1,495,000 | $1,500,000 | 14 | 3 | 3|0 | 1,498 | 61 |
| 1735 Cunningham Street | $1,398,000 | $1,300,000 | 56 | 4 | 2|0 | 1,666 | 68 |
| 2086 Del Monte Avenue | $1,100,000 | $1,040,000 | 28 | 3 | 2|0 | 1,240 | 63 |
| 2223 Dianne Drive | $1,399,000 | $1,418,000 | 44 | 3 | 2|0 | 1,886 | 55 |
| 3591 Earl Drive | $1,550,000 | $1,500,000 | 16 | 3 | 2|0 | 1,228 | 63 |
| 3675 Eastwood Circle | $1,299,950 | $1,405,000 | 9 | 4 | 2|0 | 1,565 | 51 |
| 3430 Eden Drive | $1,495,000 | $1,620,000 | 5 | 4 | 2|0 | 1,418 | 58 |
| 950 Elizabeth Drive | $1,295,000 | $1,330,116 | 7 | 3 | 2|0 | 1,261 | 66 |
| 622 Enright Avenue | $1,098,000 | $1,100,000 | 7 | 3 | 1|0 | 980 | 68 |
| 2163 Esperanca Avenue | $1,259,000 | $1,195,000 | 108 | 4 | 2|1 | 1,599 | 20 |
| 1515 Farmer Place | $1,548,000 | $1,502,000 | 56 | 4 | 3|1 | 1,993 | 8 |
| 419 Fernandez Court | $1,499,000 | $1,500,000 | 109 | 3 | 3|0 | 2,107 | 64 |
| 2164 Francis Avenue | $1,250,000 | $1,322,000 | 12 | 3 | 2|0 | 1,298 | 64 |
| 2432 Gallup Drive | $1,350,000 | $1,350,000 | 13 | 4 | 2|0 | 1,693 | 54 |
| 3362 Geneva Drive | $1,500,000 | $1,660,000 | 7 | 3 | 2|0 | 1,714 | 62 |
| 937 Hicks Drive | $1,348,000 | $1,348,000 | 27 | 4 | 3|1 | 1,609 | 0 |
| 957 Hicks Drive | $1,748,888 | $1,722,000 | 21 | 4 | 4|0 | 2,057 | 0 |
| 3023 Homestead Road | $1,388,000 | $1,455,000 | 9 | 4 | 3|0 | 1,938 | 1 |
| 473 Lafayette Way | $950,000 | $980,000 | 3 | 3 | 2|0 | 960 | 104 |
| 345 Landeros Drive | $1,599,999 | $1,500,000 | 115 | 4 | 3|0 | 2,222 | 43 |
| 2289 Lenox Place | $1,195,000 | $1,170,000 | 71 | 3 | 2|1 | 1,667 | 21 |
| 746 Los Padres Boulevard | $1,050,000 | $1,058,000 | 6 | 3 | 1|1 | 1,085 | 65 |
| 371 Lowell Drive | $1,599,888 | $1,600,000 | 6 | 3 | 2|0 | 1,508 | 61 |
| 1174 Madison Street | $1,189,000 | $1,221,000 | 7 | 3 | 2|0 | 1,136 | 71 |
| 4213 Marston Lane | $1,649,000 | $1,680,000 | 6 | 3 | 3|1 | 2,128 | 16 |
| 2890 Mauricia Avenue | $1,488,000 | $1,700,000 | 8 | 3 | 2|0 | 1,242 | 57 |
| 1661 Nelson Drive | $1,148,000 | $1,186,000 | 28 | 3 | 2|0 | 1,351 | 59 |
| 2382 Nobili Avenue | $1,380,000 | $1,351,000 | 27 | 3 | 2|0 | 1,368 | 60 |
| 3597 Notre Dame Drive | $1,830,500 | $1,700,000 | 73 | 5 | 4|0 | 3,076 | 54 |
| 788 Orkney Avenue | $1,025,000 | $1,050,000 | 3 | 3 | 2|0 | 1,097 | 58 |
| 2512 Painted Rock Drive | $1,348,000 | $1,438,000 | 12 | 3 | 2|0 | 1,415 | 65 |
| 2497 Pilot Knob Drive | $950,000 | $910,000 | 7 | 3 | 1|0 | 897 | 65 |
| 125 Rodonovan Drive | $1,599,950 | $1,750,000 | 14 | 3 | 1|1 | 1,565 | 66 |
| 2342 Rosita Court | $1,298,000 | $1,298,000 | 52 | 3 | 2|0 | 1,540 | 65 |
| 653 San Miguel Avenue | $1,299,888 | $1,250,000 | 31 | 3 | 2|0 | 1,131 | 62 |
| 942 Sunlite Drive | $1,195,000 | $1,220,000 | 16 | 3 | 2|0 | 1,145 | 70 |
| 1086 Sunset Drive | $1,150,000 | $1,130,000 | 12 | 3 | 1|0 | 1,039 | 69 |
| 1010 Teal Drive | $1,699,000 | $1,720,000 | 44 | 4 | 2|0 | 1,649 | 58 |
| 2366 Warburton Avenue | $1,198,000 | $1,200,000 | 7 | 3 | 1|0 | 1,416 | 69 |
| 3085 Warburton Avenue | $1,385,000 | $1,384,000 | 26 | 3 | 2|1 | 1,534 | 62 |
| 520 Woodstock Way | $1,155,000 | $1,110,000 | 1 | 4 | 2|0 | 1,666 | 51 |
June 2019 home sales CLICK HERE.
May 2019 home sales CLICK HERE.
April 2019 home sales CLICK HERE.
March 2019 home sales CLICK HERE.
February 2019 home sales CLICK HERE.
January 2019 home sales CLICK HERE.
December 2018 home sales CLICK HERE.
November 2018 home sales CLICK HERE.
October 2018 home sales CLICK HERE.
September 2018 home sales CLICK HERE.
August 2018 home sales CLICK HERE.
July 2018 home sales CLICK HERE.
June 2018 home sales CLICK HERE.
May 2018 home sales CLICK HERE.
Check out your home’s current value online, quick and free with our new Santa Clara Home Valuation Tool.
Planning to sell or just want to stay on top of the market, get our professional MARKET REPORTS by Altos Research. Monitor inventory, prices, and market changes.
To Sign up for Free Market Reports:


