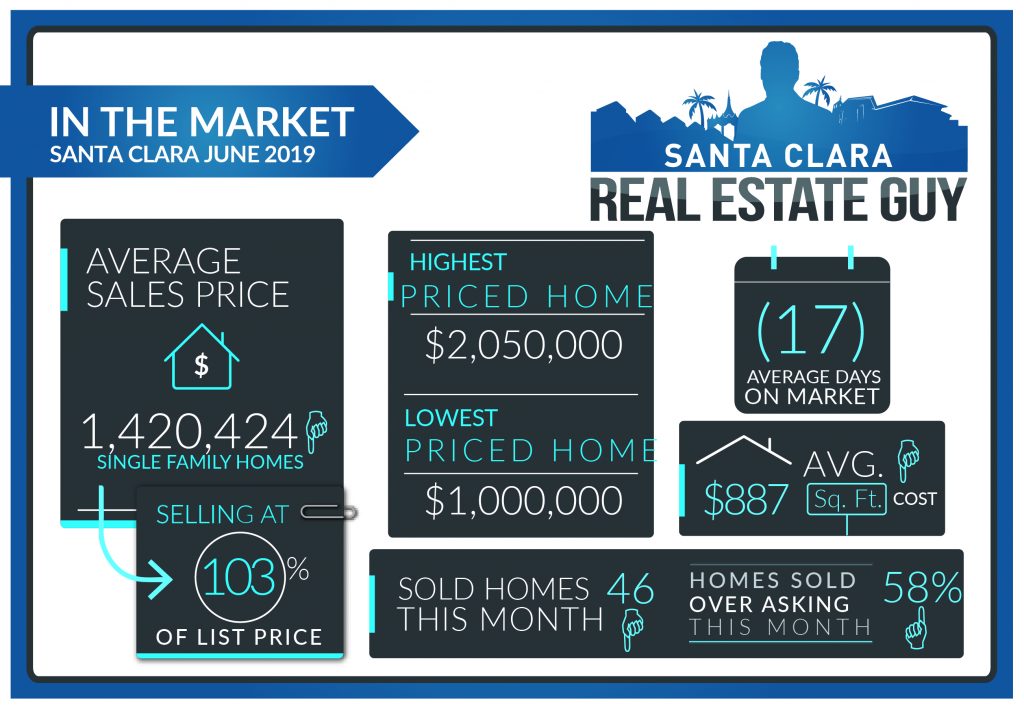
2019 June home sales in Santa Clara consisted of 46 single-family homes that closed escrow, a decrease from the 64 homes sold in May. Average days on market decreased to 19 days from 23 days, and median days decreased to 10 from 12. The average price of a home sold in June 2019 was $1.42M which is about $80K lower than last month’s figure of $1.50M.
The Median price home sold was $1.39M, which is about $100K lower than May’s median price. The average cost per square foot decreased from $968 per sqft. to $887. Of the 46 homes sold in June, 27 sold over asking. On average 3.8% over asking compared to 2.2% over asking in the previous month.

June saw a significant slow down in home sales in Santa Clara. We began June with 67 homes on the market in all of Santa Clara and ended with 83. At the highest point in June, there were 92 homes listed.
Inventory increased in June, but not at the levels we have seen from previous months. It seems like the market is finding its feet. There are some price reductions for overpriced homes, but well-priced homes are selling and selling quickly and over list price.
Last year inventory in the Summer dried up and the market tightened up in August. We may see a repeat of that this year. This month, however, the FED is meeting and some are speculating that they will reduce interest rates. This may motivate more buying, like it did earlier in the year when the FED paused its rate hikes. In the meantime, sellers remain cautious about overpricing and buyers prices have settled, not sure they will settle much more during the Summer.
| Street Address | List Price | Price | DOM | Beds Total | Bths | Sq Ft Total | Age |
| 2344 Arguello Place | $1,298,000 | $1,298,000 | 20 | 3 | 2|0 | 1,488 | 69 |
| 658 Armanini Avenue | $1,298,888 | $1,400,000 | 10 | 3 | 2|1 | 1,686 | 69 |
| 723 Armanini Avenue | $1,688,888 | $1,755,000 | 7 | 3 | 2|1 | 1,883 | 69 |
| 746 Armanini Avenue | $895,000 | $1,025,000 | 5 | 2 | 1|0 | 836 | 69 |
| 2129 Avenida De Las Flores | $920,000 | $1,000,000 | 9 | 4 | 2|0 | 1,584 | 43 |
| 636 Barto Street | $1,248,000 | $1,330,000 | 16 | 4 | 2|0 | 1,092 | 66 |
| 2272 Benton Street | $1,150,000 | $1,191,000 | 8 | 3 | 1|0 | 1,083 | 68 |
| 1646 Berna Street | $1,398,000 | $1,470,000 | 7 | 3 | 2|0 | 1,547 | 68 |
| 1953 Bohannon Drive | $1,488,000 | $1,488,000 | 8 | 3 | 2|0 | 1,631 | 67 |
| 2245 Bohannon Drive | $1,449,950 | $1,400,000 | 30 | 5 | 2|0 | 1,565 | 67 |
| 944 Capitola Way | $1,460,000 | $1,585,000 | 6 | 4 | 2|0 | 2,128 | 55 |
| 148 Douglane Avenue | $1,499,000 | $1,505,000 | 9 | 4 | 2|1 | 1,899 | 70 |
| 3560 Druffel Place | $1,399,000 | $1,450,000 | 9 | 3 | 3|1 | 1,839 | 10 |
| 2237 Forbes Avenue | $1,098,000 | $1,110,000 | 7 | 3 | 1|0 | 1,052 | 68 |
| 3312 Geneva Drive | $1,895,000 | $1,850,000 | 14 | 3 | 2|0 | 1,996 | 62 |
| 663 Hamilton Lane | $1,199,000 | $1,290,000 | 11 | 4 | 2|0 | 1,127 | 66 |
| 947 Hicks Drive | $1,348,000 | $1,348,000 | 7 | 4 | 3|1 | 1,609 | 0 |
| 2085 Hogan Drive | $1,188,000 | $1,150,000 | 8 | 4 | 2|0 | 1,707 | 59 |
| 3029 Homestead Road | $1,950,000 | $1,950,000 | 0 | 5 | 4|1 | 2,285 | 0 |
| 3031 Homestead Road | $1,588,000 | $1,750,000 | 10 | 4 | 3|0 | 2,198 | 1 |
| 2417 Johnson Place | $1,249,000 | $1,365,000 | 8 | 3 | 2|0 | 1,231 | 63 |
| 2059 Kimberlin Place | $1,458,000 | $1,500,000 | 13 | 4 | 3|0 | 2,068 | 27 |
| 4433 Laird Circle | $1,350,000 | $1,335,000 | 9 | 3 | 3|0 | 1,590 | 14 |
| 961 Las Palmas Drive | $1,248,000 | $1,200,000 | 37 | 3 | 2|0 | 1,166 | 64 |
| 3654 Londonderry Drive | $995,000 | $1,350,000 | 74 | 4 | 2|1 | 1,800 | 64 |
| 2527 Malone Place | $1,398,888 | $1,610,000 | 11 | 4 | 3|0 | 2,177 | 62 |
| 2367 Manhattan Place | $1,299,000 | $1,335,000 | 0 | 3 | 2|0 | 1,095 | 61 |
| 2603 Meadowbrook Drive | $1,650,000 | $1,610,000 | 19 | 3 | 2|0 | 1,936 | 11 |
| 930 Monroe Street | $1,600,000 | $1,600,000 | 0 | 3 | 1|1 | 2,667 | 113 |
| 2872 Orthello Way | $1,500,000 | $1,580,000 | 0 | 3 | 2|0 | 1,987 | 68 |
| 610 Park Court | $1,125,000 | $1,090,000 | 90 | 4 | 2|0 | 1,416 | 94 |
| 1445 Pomeroy Avenue | $1,375,000 | $1,290,000 | 80 | 4 | 2|0 | 2,300 | 67 |
| 2316 Remo Court | $1,100,000 | $1,160,500 | 12 | 4 | 2|0 | 1,352 | 42 |
| 780 Ridge Road | $1,295,000 | $1,370,000 | 8 | 4 | 2|0 | 1,310 | 64 |
| 669 Salberg Avenue | $1,299,000 | $1,575,000 | 4 | 4 | 2|0 | 1,652 | 65 |
| 3491 San Marcos Way | $1,398,000 | $1,410,000 | 34 | 3 | 2|0 | 1,400 | 64 |
| 993 Scott Boulevard | $1,088,888 | $1,088,000 | 22 | 3 | 2|0 | 1,468 | 67 |
| 1927 Stanley Avenue | $1,355,000 | $1,360,000 | 40 | 3 | 2|0 | 1,595 | 60 |
| 2348 Susan Drive | $1,299,998 | $1,210,000 | 41 | 3 | 1|1 | 1,628 | 61 |
| 2184 Talia Avenue | $1,549,000 | $1,550,000 | 13 | 3 | 2|0 | 1,550 | 67 |
| 2345 Thompson Place | $1,225,000 | $1,305,000 | 9 | 2 | 3|0 | 1,141 | 69 |
| 3360 Tracy Drive | $1,799,888 | $2,050,000 | 4 | 4 | 3|0 | 2,482 | 62 |
| 1361 Via Dondera | $1,468,000 | $1,453,000 | 18 | 4 | 3|0 | 2,446 | 65 |
| 3066 Via Siena Place | $1,868,000 | $1,800,000 | 17 | 4 | 2|1 | 1,931 | 4 |
| 2366 Warburton Avenue | $1,198,000 | $1,198,000 | 4 | 3 | 1|0 | 1,416 | 69 |
| 753 Yale Lane | $1,499,000 | $1,600,000 | 12 | 3 | 2|0 | 1,442 | 58 |
May 2019 home sales CLICK HERE.
April 2019 home sales CLICK HERE.
March 2019 home sales CLICK HERE.
February 2019 home sales CLICK HERE.
January 2019 home sales CLICK HERE.
December 2018 home sales CLICK HERE.
November 2018 home sales CLICK HERE.
October 2018 home sales CLICK HERE.
September 2018 home sales CLICK HERE.
August 2018 home sales CLICK HERE.
July 2018 home sales CLICK HERE.
June 2018 home sales CLICK HERE.
May 2018 home sales CLICK HERE.
Check out your home’s current value online, quick and free with our new Santa Clara Home Valuation Tool.
Planning to sell or just want to stay on top of the market, get our professional MARKET REPORTS by Altos Research. Monitor inventory, prices, and market changes.
To Sign up for Free Market Reports:


