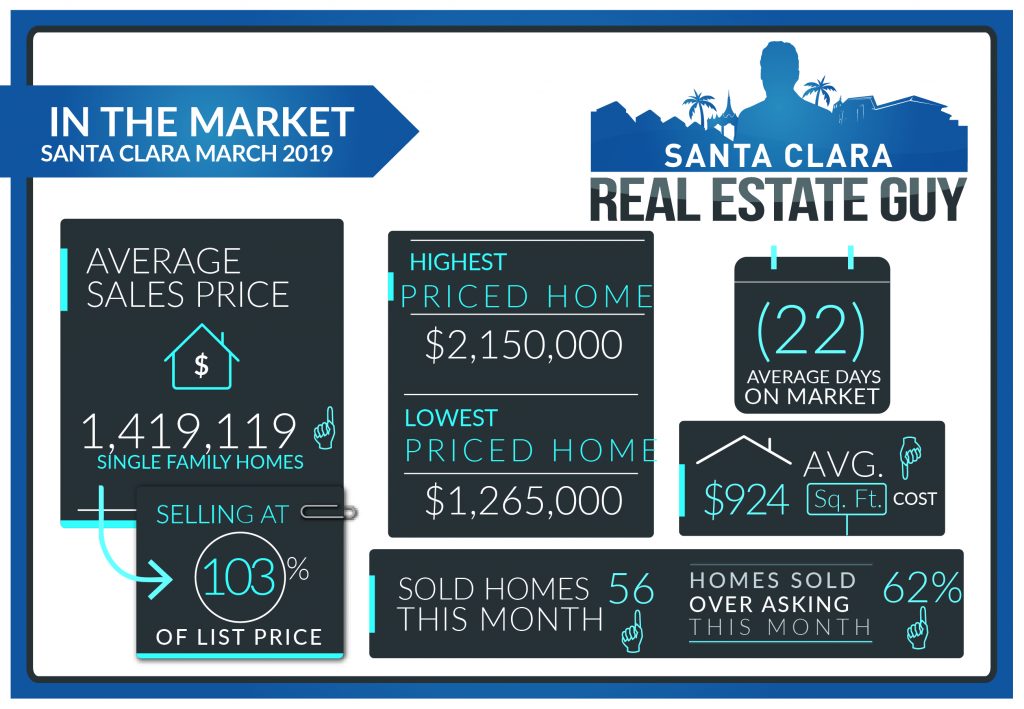
2019 March home sales in Santa Clara consisted of 56 single family homes that closed escrow, an increase from the 39 homes sold in February. Average days on market held steady at 22 days, and median days increased to 12 from 11. The average price of a home sold in March 2019 was $1.42M which is about $50K higher than last month’s figure of $1.37M and $130k higher than the previous month at $1.29M. The Median price home sold was $1.37M, which is the same as February’s median price. Average cost per square foot decreased from $940 per sqft. to $924. Of the 56 homes sold in March, 35 sold over asking. On average 3.2% over asking compared to 3.4% over asking in the previous month.

The housing market has picked up in the last few months. We are seeing more and more offers and more bidding occurring. Inventory levels have stayed pretty consistent for the last two months, even dropping below the 50 homes mark in late January. This indicates that buyers have been able to absorb new listings coming on the market, and prices have already increased beyond the 4th quarter of 2018. Much of this I attribute to the surprise policy shift by the FED that resulted in a .5% rate drop.
As we are moving more into the Spring market inventory has finally increased. We are currently over 50 single family homes for sale in Santa Clara, seasonally this number should increase and the market should simmer down with more inventory. In the meantime, buyers expect multiple offers and bidding on hot listings. Sellers make sure to price your homes accurately and they will sell.
| Street Address | List Price | Price | DOM | Beds Total | Bths | Sq Ft Total | Age |
| 2145 3rd Street | $1,398,000 | $1,410,000 | 21 | 3 | 2|1 | 1,589 | 19 |
| 2423 Amethyst Drive | $999,000 | $1,050,000 | 8 | 3 | 2|0 | 897 | 65 |
| 3004 Aspen Drive | $1,550,000 | $1,720,000 | 8 | 4 | 2|0 | 1,687 | 56 |
| 851 Baird Avenue | $899,000 | $920,000 | 17 | 3 | 2|0 | 1,097 | 58 |
| 497 Bancroft Street | $1,888,000 | $2,000,000 | 11 | 4 | 2|1 | 2,215 | 59 |
| 710 Baylor Drive | $1,888,888 | $1,688,880 | 18 | 5 | 3|0 | 2,113 | 58 |
| 1511 Bellomy Street | $1,100,000 | $1,125,000 | 0 | 3 | 1|0 | 1,352 | 73 |
| 2344 Benton Street | $1,599,000 | $1,650,000 | 83 | 4 | 4|0 | 2,225 | 65 |
| 2459 Benton Street | $895,000 | $975,000 | 14 | 3 | 2|0 | 1,134 | 64 |
| 1871 Briarwood Drive | $1,395,000 | $1,370,000 | 9 | 3 | 2|0 | 1,124 | 65 |
| 3567 Brothers Lane | $1,688,000 | $1,688,000 | 6 | 4 | 3|1 | 2,462 | 1 |
| 4581 Burke Drive | $899,950 | $925,000 | 9 | 4 | 2|0 | 1,095 | 59 |
| 336 Burnett Avenue | $1,899,000 | $1,770,000 | 45 | 4 | 3|0 | 1,638 | 63 |
| 3424 Cecil Avenue | $988,000 | $1,160,000 | 7 | 2 | 1|0 | 1,207 | 71 |
| 830 Civic Center Drive | $1,550,000 | $1,330,000 | 62 | 4 | 3|1 | 1,890 | 0 |
| 2106 Denise Drive | $1,588,000 | $1,600,000 | 34 | 4 | 2|1 | 2,664 | 51 |
| 3723 Edgefield Drive | $1,249,000 | $1,325,000 | 8 | 3 | 2|0 | 1,312 | 52 |
| 2737 El Sobrante Street | $1,099,990 | $1,170,000 | 8 | 3 | 1|0 | 1,000 | 63 |
| 601 Enright Avenue | $1,750,000 | $1,900,000 | 6 | 4 | 2|0 | 2,041 | 68 |
| 658 Enright Avenue | $1,249,000 | $1,375,000 | 7 | 3 | 2|0 | 1,670 | 69 |
| 647 Fallon Avenue | $1,399,000 | $1,507,000 | 7 | 4 | 2|0 | 1,678 | 72 |
| 2840 Fargher Drive | $1,499,000 | $1,395,000 | 55 | 3 | 2|1 | 1,639 | 30 |
| 2841 Fargher Drive | $1,388,000 | $1,450,000 | 0 | 3 | 2|1 | 2,095 | 30 |
| 3085 Fresno Street | $1,399,950 | $1,370,000 | 128 | 3 | 2|0 | 1,749 | 70 |
| 3442 Geneva Drive | $2,000,000 | $2,060,000 | 12 | 5 | 3|0 | 2,696 | 62 |
| 109 Gilbert Avenue | $1,795,000 | $1,905,000 | 15 | 4 | 2|0 | 1,568 | 61 |
| 4728 Gillmor Street | $1,349,000 | $1,460,000 | 15 | 4 | 2|1 | 1,850 | 42 |
| 1758 Higgins Avenue | $1,099,888 | $1,063,000 | 12 | 3 | 1|0 | 1,038 | 66 |
| 1729 Jeffery Court | $1,350,000 | $1,461,000 | 12 | 3 | 2|0 | 1,330 | 63 |
| 2491 Johnson Place | $1,799,000 | $1,750,000 | 84 | 4 | 4|0 | 2,756 | 62 |
| 241 Kerry Drive | $1,539,000 | $1,515,000 | 29 | 3 | 2|0 | 1,679 | 64 |
| 2138 Kingsbury Circle | $999,888 | $1,160,000 | 40 | 4 | 2|1 | 1,602 | 19 |
| 289 La Herran Drive | $1,488,888 | $1,708,000 | 4 | 3 | 2|0 | 1,284 | 62 |
| 2386 Lass Drive | $1,699,000 | $1,760,000 | 14 | 5 | 3|0 | 2,326 | 22 |
| 753 Laurie Avenue | $1,175,000 | $1,120,000 | 27 | 3 | 2|0 | 1,207 | 58 |
| 1361 Los Padres Boulevard | $1,399,000 | $1,300,000 | 21 | 3 | 1|1 | 1,359 | 64 |
| 2045 Main Street | $1,188,800 | $1,150,000 | 40 | 3 | 2|0 | 1,411 | 73 |
| 3801 Mark Spitz Place | $1,700,000 | $1,700,000 | 0 | 4 | 3|1 | 2,227 | 1 |
| 3802 Mark Spitz Place | $1,498,000 | $1,615,000 | 137 | 4 | 3|1 | 2,050 | 0 |
| 1374 Maryann Drive | $1,300,000 | $1,300,000 | 2 | 2 | 1|1 | 1,622 | 63 |
| 580 Mission Street | $949,990 | $1,100,000 | 8 | 3 | 1|1 | 1,180 | 75 |
| 2171 Monterey Avenue | $1,248,000 | $1,381,800 | 8 | 3 | 2|0 | 1,078 | 64 |
| 2075 Morrison Avenue | $988,888 | $1,151,000 | 0 | 3 | 2|0 | 1,207 | 60 |
| 1928 Murguia Avenue | $1,174,950 | $1,265,000 | 7 | 3 | 1|0 | 1,216 | 72 |
| 3032 Orthello Way | $1,200,000 | $1,155,000 | 13 | 5 | 2|1 | 1,800 | 68 |
| 3031 Pruneridge Avenue | $1,550,000 | $1,500,000 | 6 | 4 | 2|0 | 1,687 | 56 |
| 1245 Reed Street | $1,225,000 | $1,270,000 | 7 | 3 | 2|0 | 1,136 | 64 |
| 3156 San Juan Avenue | $1,188,000 | $1,150,000 | 18 | 4 | 2|0 | 1,095 | 61 |
| 2155 San Rafael Avenue | $1,298,000 | $1,280,000 | 49 | 3 | 3|0 | 1,730 | 64 |
| 1224 Sherwood Avenue | $898,888 | $950,000 | 7 | 2 | 1|0 | 744 | 26 |
| 1936 Stanley Avenue | $1,188,000 | $1,215,000 | 12 | 3 | 2|0 | 1,130 | 64 |
| 1073 Sunlite Drive | $998,000 | $1,202,000 | 7 | 4 | 2|0 | 1,398 | 69 |
| 3390 Tracy Drive | $1,689,000 | $1,800,000 | 0 | 3 | 2|0 | 1,265 | 62 |
| 3649 Vireo Avenue | $2,098,000 | $2,150,000 | 7 | 4 | 2|1 | 2,701 | 26 |
| 2795 Warburton Avenue | $1,295,000 | $1,250,000 | 21 | 3 | 2|0 | 1,237 | 61 |
| 1062 Waterbird Way | $1,800,000 | $1,750,000 | 17 | 3 | 3|0 | 1,677 | 58 |
February 2019 home sales CLICK HERE.
January 2019 home sales CLICK HERE.
December 2018 home sales CLICK HERE.
November 2018 home sales CLICK HERE.
October 2018 home sales CLICK HERE.
September 2018 home sales CLICK HERE.
August 2018 home sales CLICK HERE.
July 2018 home sales CLICK HERE.
June 2018 home sales CLICK HERE.
May 2018 home sales CLICK HERE.
Check out your home’s current value online, quick and free with our new Santa Clara Home Valuation Tool.
https://SantaClara.freehomevalues.net
Planning to sell or just want to stay on top of the market, get our professional MARKET REPORTS by Altos Research. Monitor inventory, prices, and market changes.
To Sign up for Free Market Reports:


