Click here for March 2019

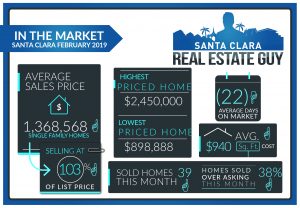
2019 February home sales in Santa Clara consisted of 39 single family homes that closed escrow, an increase from the 26 homes sold in January. Average days on market decreased to 22 days from 35 the prior month, and median days decreased to 11 from 27. The average price of a home sold in February 2019 was $1.37M which is about $90K higher than last month’s figure of $1.28M and $70k higher than the previous month at $1.3M. The Median price home sold was $1.37M, which is above January’s median price of 1.21M. Average cost per square foot increased from $912 per sqft. to $940. Of the 39 homes sold in February, 15 sold over asking. On average 3.4% over asking compared to 1.8% under asking in the previous month.
The market has recently been experiencing multiple offers due to limited or low inventory and a shift in policy by the FED that dropped rates about half a percent. Currently, there are 51 homes on the market as of the end of the month. At the beginning of January, we started with just 30 homes and grew to 43 in February. The market has been very active in the last few weeks with homes selling over list price. However, we are starting at the highest level of inventory in the last 7 years so I expect inventory levels to be higher this year.
| Street Address | List Price | Price | DOM | Beds Total | Bths | Sq Ft Total | Age |
| 756 Armanini Avenue | $1,050,000 | $1,100,000 | 10 | 2 | 1|0 | 836 | 69 |
| 225 Bret Harte Court | $1,549,888 | $1,420,000 | 84 | 4 | 3|0 | 1,658 | 63 |
| 3565 Brothers Lane | $1,688,000 | $1,680,000 | 0 | 4 | 3|1 | 2,462 | 1 |
| 3569 Brothers Lane | $1,688,000 | $1,680,000 | 16 | 4 | 3|1 | 2,462 | 0 |
| 673 Bucher Avenue | $949,000 | $1,052,000 | 18 | 3 | 2|0 | 1,230 | 65 |
| 4392 Burdick Lane | $2,280,000 | $2,450,000 | 9 | 5 | 4|0 | 3,113 | 15 |
| 2640 Castello Way | $1,140,000 | $1,135,000 | 9 | 4 | 2|0 | 1,158 | 59 |
| 2305 Cimarron Drive | $1,398,000 | $1,501,000 | 8 | 5 | 3|0 | 2,093 | 51 |
| 2186 Del Monte Avenue | $1,349,000 | $1,340,000 | 9 | 3 | 2|0 | 1,240 | 63 |
| 2526 Dixon Drive | $1,299,000 | $1,270,000 | 63 | 4 | 3|0 | 1,986 | 63 |
| 2287 Dolores Avenue | $1,799,950 | $1,753,400 | 23 | 4 | 3|1 | 2,420 | 65 |
| 3522 Eastin Place | $1,388,000 | $1,480,800 | 7 | 3 | 3|1 | 1,861 | 14 |
| 2904 El Sobrante St | $1,399,500 | $1,325,124 | 19 | 3 | 2|1 | 1,162 | 69 |
| 1545 Farmer Place | $1,518,888 | $1,518,888 | 12 | 3 | 4|0 | 1,998 | 10 |
| 3465 Forest Avenue | $900,000 | $1,250,000 | 7 | 3 | 2|0 | 1,141 | 64 |
| 3433 Fowler Avenue | $1,499,000 | $1,600,000 | 10 | 4 | 2|0 | 1,535 | 65 |
| 2888 Fresno Street | $988,000 | $1,150,000 | 9 | 3 | 1|0 | 1,236 | 71 |
| 3048 Fresno Street | $888,888 | $1,000,000 | 0 | 2 | 1|0 | 1,162 | 69 |
| 3160 Humbolt Avenue | $1,388,000 | $1,380,000 | 10 | 3 | 2|0 | 1,384 | 68 |
| 1189 Inverness Avenue | $1,500,000 | $1,400,000 | 32 | 3 | 3|0 | 2,011 | 68 |
| 2543 Johnson Place | $1,248,000 | $1,200,000 | 45 | 3 | 2|0 | 1,340 | 61 |
| 2159 Kingsbury Circle | $1,095,000 | $1,105,000 | 59 | 3 | 2|1 | 1,400 | 18 |
| 1719 Lawrence Road | $1,748,000 | $1,740,000 | 0 | 5 | 3|1 | 2,556 | 1 |
| 1637 Long Street | $1,425,000 | $1,445,000 | 53 | 3 | 2|1 | 1,618 | 67 |
| 976 Los Padres Boulevard | $1,110,000 | $1,100,000 | 14 | 3 | 1|1 | 1,156 | 67 |
| 3220 Machado Avenue | $1,395,000 | $1,330,000 | 84 | 3 | 2|0 | 1,078 | 63 |
| 991 Madeline Lane | $1,148,000 | $1,148,000 | 13 | 3 | 2|0 | 1,476 | 67 |
| 3628 Magellan Avenue | $1,549,000 | $1,500,000 | 65 | 3 | 2|0 | 1,147 | 61 |
| 654 Malarin Avenue | $1,698,000 | $1,666,000 | 21 | 4 | 3|0 | 1,793 | 67 |
| 2517 Marchese Way | $1,389,000 | $1,389,000 | 11 | 4 | 3|0 | 1,812 | 59 |
| 945 Maryann Drive | $1,098,000 | $1,160,000 | 7 | 3 | 1|0 | 1,036 | 66 |
| 2870 Mauricia Avenue | $1,575,000 | $1,516,000 | 9 | 3 | 2|0 | 1,242 | 57 |
| 3525 Notre Dame Drive | $1,279,000 | $1,350,000 | 8 | 3 | 2|0 | 1,328 | 62 |
| 3463 San Marcos Way | $1,250,000 | $1,400,000 | 8 | 3 | 2|0 | 1,212 | 65 |
| 1224 Sherwood Avenue | $898,888 | $898,888 | 7 | 2 | 1|0 | 744 | 26 |
| 1026 Sunset Drive | $999,000 | $1,178,000 | 7 | 4 | 2|0 | 1,495 | 69 |
| 3749 Swallow Way | $1,728,000 | $1,682,000 | 66 | 4 | 3|0 | 1,700 | 57 |
| 3559 Warburton Avenue | $1,748,000 | $1,748,000 | 18 | 5 | 3|1 | 2,554 | 0 |
| 3561 Warburton Avenue | $1,728,000 | $1,728,000 | 0 | 4 | 3|1 | 2,695 | 1 |
January 2019 home sales CLICK HERE.
December 2018 home sales CLICK HERE.
November 2018 home sales CLICK HERE.
October 2018 home sales CLICK HERE.
September 2018 home sales CLICK HERE.
August 2018 home sales CLICK HERE.
July 2018 home sales CLICK HERE.
June 2018 home sales CLICK HERE.
May 2018 home sales CLICK HERE.
Check out your home’s current value online, quick and free with our new Santa Clara Home Valuation Tool.
https://SantaClara.freehomevalues.net
Planning to sell or just want to stay on top of the market, get our professional MARKET REPORTS by Altos Research. Monitor inventory, prices, and market changes.
To Sign up for Free Market Reports:


