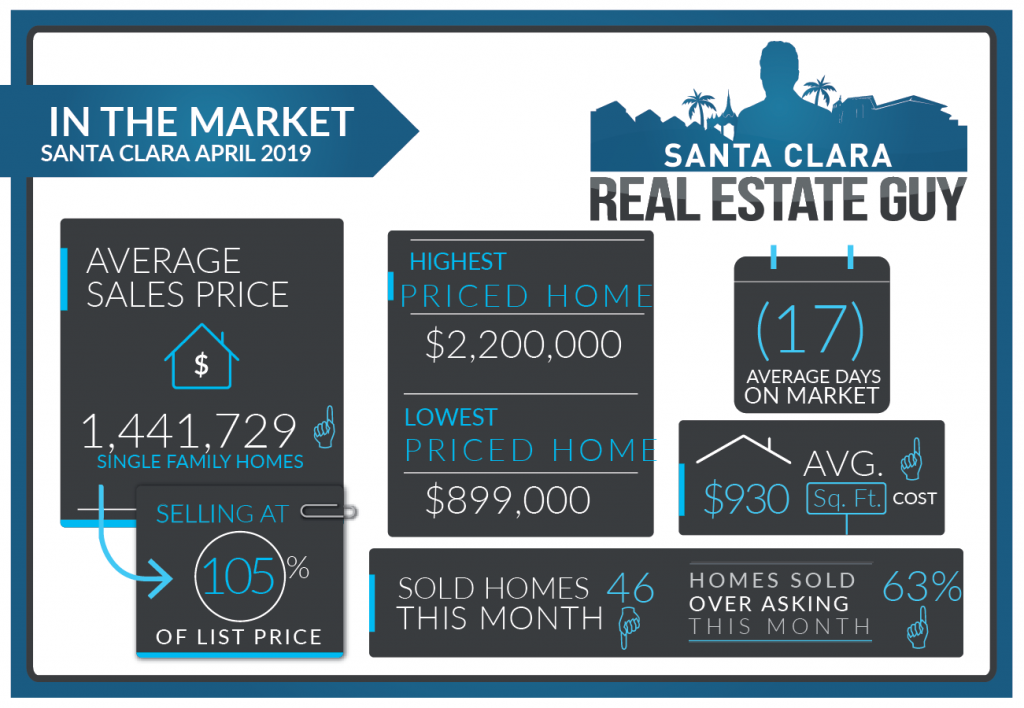
2019 April home sales in Santa Clara consisted of 46 single family homes that closed escrow, a decrease from the 56 homes sold in March. Average days on market dropped to 17 days, and median days decreased to 10.5 from 12. The average price of a home sold in April 2019 was $1.44M which is about $20K higher than last month’s figure of $1.42M and $70k higher than the previous month at $1.37M. The Median price home sold was $1.39M, which is about $20K higher than February’s median price. The average cost per square foot increased from $924 per sqft. to $930. Of the 46 homes sold in April, 29 sold over asking. On average 5.2% over asking compared to 3.2% over asking in the previous month.

April was a tight month for home sales, a rare occasion when inventory drops as we are moving deeper into Spring. With lower inventory, we experienced a tougher seller’s market with multiple offers and rising home values.
The week after Easter weekend, 20 new listings came up and inventory shot up from the mid-’40s to the mid-’60s where we are now approximately. The market appreciation should slow as many of these homes will not sell within the first week of being on the market. It’s important to monitor where inventory goes from here. Does it stay steady, does it drop or will it continue to rise. The next few weeks could indicate the strength of the market in the coming months.
| Street Address | List Price | Price | DOM | Beds Total | Bths | Sq Ft Total | Age |
| 2275 2nd Street | $1,188,000 | $1,342,000 | 10 | 4 | 2|0 | 1,584 | 42 |
| 3038 Alexander Avenue | $1,295,000 | $1,550,000 | 8 | 3 | 2|0 | 1,468 | 64 |
| 3157 Allen Way | $1,680,000 | $1,820,000 | 9 | 3 | 2|0 | 1,406 | 62 |
| 3340 Allen Court | $1,250,000 | $1,458,000 | 7 | 3 | 2|0 | 1,400 | 61 |
| 2558 Amethyst Drive | $1,499,950 | $1,520,000 | 20 | 4 | 3|1 | 2,639 | 64 |
| 2224 Augusta Place | $1,200,000 | $1,290,000 | 6 | 4 | 2|0 | 1,095 | 61 |
| 2691 Barcells Avenue | $1,299,000 | $1,350,000 | 19 | 3 | 2|0 | 1,145 | 64 |
| 2929 Barkley Avenue | $1,348,000 | $1,390,000 | 7 | 3 | 2|0 | 1,170 | 62 |
| 3750 Benton Street | $1,998,998 | $2,200,000 | 6 | 4 | 2|1 | 2,350 | 26 |
| 3596 Berry Way | $1,249,000 | $1,300,000 | 7 | 3 | 2|0 | 1,240 | 63 |
| 2068 Carpenter Place | $1,488,000 | $1,458,000 | 18 | 4 | 3|0 | 2,177 | 28 |
| 1786 Catherine Street | $1,600,000 | $1,550,000 | 98 | 6 | 3|0 | 2,651 | 158 |
| 1605 Chestnut Street | $1,790,000 | $1,710,000 | 17 | 5 | 4|0 | 3,226 | 120 |
| 630 Clara Vista Avenue | $1,198,000 | $1,255,000 | 15 | 3 | 1|1 | 1,145 | 62 |
| 1254 Crowley Avenue | $1,228,800 | $1,400,000 | 5 | 3 | 2|0 | 1,479 | 64 |
| 2116 Del Monte Avenue | $999,000 | $1,375,000 | 0 | 3 | 2|0 | 1,240 | 63 |
| 185 Douglane Avenue | $1,999,999 | $1,800,000 | 53 | 3 | 3|1 | 2,394 | 71 |
| 3816 Dunford Way | $1,680,000 | $1,680,000 | 7 | 3 | 2|0 | 1,388 | 58 |
| 3699 Eastwood Circle | $1,198,000 | $1,300,000 | 1 | 3 | 2|0 | 1,312 | 52 |
| 2543 Elliot Street | $1,395,000 | $1,517,000 | 8 | 3 | 2|0 | 1,696 | 57 |
| 1251 Foley Avenue | $1,125,000 | $1,200,000 | 16 | 3 | 1|0 | 1,000 | 63 |
| 2962 Fresno Street | $1,599,000 | $1,615,000 | 8 | 3 | 3|0 | 1,920 | 71 |
| 3027 Homestead Road | $1,788,000 | $1,788,000 | 15 | 5 | 4|1 | 2,285 | 0 |
| 500 Kiely Boulevard | $999,900 | $1,275,000 | 5 | 3 | 2|0 | 1,442 | 56 |
| 4516 Lakeshore Drive | $1,399,888 | $1,440,000 | 23 | 4 | 2|1 | 1,850 | 42 |
| 991 Las Palmas Drive | $1,197,000 | $1,186,000 | 35 | 3 | 2|0 | 1,466 | 64 |
| 717 Layton Court | $1,688,000 | $1,660,000 | 20 | 4 | 2|1 | 1,948 | 65 |
| 1235 Lewis Street | $899,000 | $899,000 | 15 | 3 | 2|0 | 972 | 104 |
| 613 Los Padres Boulevard | $1,199,000 | $1,280,000 | 9 | 3 | 2|0 | 1,096 | 64 |
| 752 Los Padres Boulevard | $1,198,000 | $1,265,000 | 8 | 3 | 2|0 | 1,013 | 65 |
| 3225 Machado Avenue | $999,000 | $999,000 | 9 | 3 | 2|0 | 1,078 | 64 |
| 431 Magnolia Lane | $1,988,000 | $2,100,000 | 16 | 5 | 4|1 | 3,628 | 59 |
| 668 Malarin Avenue | $1,488,000 | $1,575,000 | 13 | 3 | 2|0 | 1,519 | 68 |
| 2890 Mark Avenue | $1,369,000 | $1,425,000 | 12 | 3 | 2|1 | 1,534 | 62 |
| 1828 Market Street | $1,188,000 | $1,174,000 | 20 | 3 | 2|1 | 1,366 | 12 |
| 1399 Mcpherson Street | $1,198,000 | $1,210,000 | 8 | 3 | 2|0 | 1,166 | 65 |
| 1405 Mcpherson Street | $1,349,000 | $1,380,000 | 5 | 3 | 2|0 | 1,808 | 65 |
| 2640 Monroe Street | $1,588,000 | $1,550,000 | 112 | 3 | 2|0 | 1,742 | 60 |
| 1585 Newhall Street | $1,100,000 | $1,280,000 | 21 | 3 | 2|0 | 1,592 | 73 |
| 760 Ridge Road | $1,198,800 | $1,310,000 | 7 | 3 | 2|0 | 1,339 | 63 |
| 713 Scott Boulevard | $1,049,000 | $1,049,000 | 11 | 3 | 1|0 | 1,190 | 72 |
| 2718 Taft Avenue | $1,925,000 | $1,925,000 | 9 | 4 | 2|1 | 2,110 | 59 |
| 3097 Taper Avenue | $1,499,950 | $1,499,950 | 15 | 3 | 3|0 | 1,534 | 62 |
| 1661 Triton Court | $1,258,000 | $1,234,567 | 26 | 3 | 2|1 | 1,730 | 29 |
| 3350 Victoria Avenue | $1,050,000 | $1,210,000 | 3 | 3 | 2|0 | 1,080 | 65 |
| 4301 Watson Circle | $1,599,950 | $1,525,000 | 21 | 3 | 2|1 | 2,036 | 15 |
March 2019 home sales CLICK HERE.
February 2019 home sales CLICK HERE.
January 2019 home sales CLICK HERE.
December 2018 home sales CLICK HERE.
November 2018 home sales CLICK HERE.
October 2018 home sales CLICK HERE.
September 2018 home sales CLICK HERE.
August 2018 home sales CLICK HERE.
July 2018 home sales CLICK HERE.
June 2018 home sales CLICK HERE.
May 2018 home sales CLICK HERE.
Check out your home’s current value online, quick and free with our new Santa Clara Home Valuation Tool.
Planning to sell or just want to stay on top of the market, get our professional MARKET REPORTS by Altos Research. Monitor inventory, prices, and market changes.
To Sign up for Free Market Reports:


