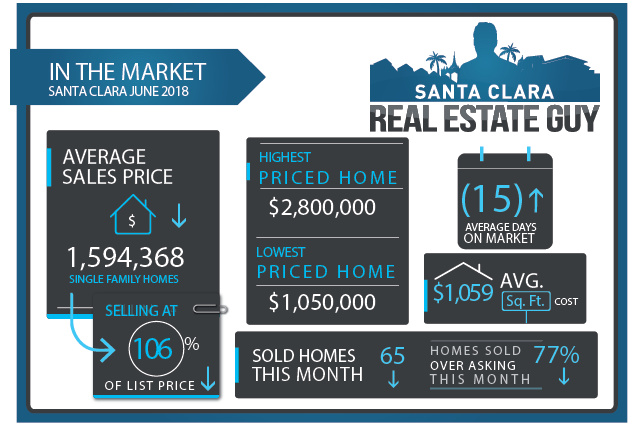
2018 Santa Clara June home sales consisted of 65 single family homes sold in Santa Clara, an increase of the 21 homes sold in May and 50 homes in April. The market has remained fairly steady with no significant price drops, but some slowness which can be expected this time of year. Average days on market increased to 15 from 13 and median days on market 12 from 9 in the previous month. The average price of a home sold in June 2018 was $1.594M about $60k lower than last months $1.652M. The Median price home was $1.538M, about $30K less than May’s median price. Of the 65 homes sold in June, 54 sold over asking on average 6% over asking compared to 12% over asking in the previous month. Keep in mind of the homes that are not selling and sitting on the market.
The market is steady, but slowing down in the Summer. This is typical for this time of year. The question is will the market start to tighten up again in fall or will inventory continue to rise and push the market more towards a buyer’s market.
| Street Address | List Price | Price | DOM | BD | BA | Sq Ft |
| 1452 Heatherdale Avenue | $1,698,000 | $1,550,000 | 44 | 4 | 2|0 | 1,482 |
| 1795 Jackson Street | $1,200,000 | $1,100,000 | 24 | 2 | 1|0 | 1,000 |
| 1435 Bergin Place | $1,499,000 | $1,385,000 | 28 | 3 | 3|0 | 1,647 |
| 1226 Jackson Street | $1,549,000 | $1,445,000 | 35 | 3 | 2|1 | 2,075 |
| 2838 Forbes Avenue | $1,828,000 | $1,750,000 | 19 | 4 | 2|1 | 2,277 |
| 4101 Tobin Circle | $1,489,000 | $1,435,500 | 29 | 3 | 3|0 | 1,590 |
| 4101 Tobin Cir | $1,489,000 | $1,435,500 | 12 | 3 | 3|0 | 1,590 |
| 63 Conner Place | $1,498,888 | $1,450,000 | 11 | 3 | 2|1 | 1,905 |
| 3133 Mckinley Drive | $1,950,000 | $1,900,000 | 35 | 3 | 2|0 | 1,317 |
| 2079 Fordham Drive | $1,450,000 | $1,430,000 | 16 | 3 | 2|0 | 1,587 |
| 3856 Shasta Drive | $1,725,000 | $1,707,750 | 12 | 3 | 3|0 | 1,991 |
| 3490 Clinton Avenue | $2,648,000 | $2,648,000 | 14 | 4 | 3|0 | 2,503 |
| 666 Malarin Avenue | $1,200,000 | $1,200,000 | 8 | 4 | 2|0 | 1,364 |
| 2477 Warburton Avenue | $1,299,000 | $1,300,000 | 23 | 2 | 2|0 | 1,368 |
| 2187 Talia Avenue | $1,399,950 | $1,410,000 | 12 | 3 | 2|0 | 1,183 |
| 646 Pomeroy Avenue | $1,600,000 | $1,625,000 | 18 | 3 | 2|0 | 1,462 |
| 688 Bancroft Street | $1,728,000 | $1,760,000 | 21 | 3 | 3|0 | 1,795 |
| 1397 Loyola Drive | $1,325,000 | $1,350,000 | 9 | 3 | 2|0 | 1,377 |
| 188 Cronin Drive | $1,995,000 | $2,035,000 | 10 | 3 | 2|0 | 1,760 |
| 2016 Stanley Avenue | $1,268,000 | $1,295,000 | 27 | 3 | 2|0 | 1,130 |
| 2595 Bonnie Drive | $1,568,888 | $1,615,000 | 28 | 4 | 2|0 | 1,820 |
| 28 Michael Way | $1,799,000 | $1,860,000 | 25 | 3 | 2|0 | 1,274 |
| 1137 FAIRFIELD Avenue | $1,398,000 | $1,450,000 | 19 | 4 | 2|0 | 1,348 |
| 152 Blake Avenue | $1,799,000 | $1,868,000 | 12 | 3 | 2|0 | 1,347 |
| 2044 Jackson Street | $999,950 | $1,050,000 | 9 | 3 | 1|1 | 1,050 |
| 3674 Macintosh Street | $1,199,000 | $1,260,000 | 15 | 4 | 2|0 | 1,449 |
| 2294 Warburton Avenue | $1,899,950 | $2,000,000 | 15 | 5 | 3|1 | 3,100 |
| 3322 Geneva Drive | $1,680,000 | $1,770,000 | 10 | 3 | 2|0 | 1,420 |
| 3551 Earl Drive | $1,450,000 | $1,530,000 | 3 | 3 | 2|0 | 1,240 |
| 2017 El Capitan Avenue | $1,325,000 | $1,400,000 | 8 | 4 | 3|0 | 1,523 |
| 3585 Butcher Drive | $1,180,000 | $1,250,000 | 36 | 3 | 2|0 | 1,166 |
| 1956 Bohannon Drive | $1,599,000 | $1,700,000 | 24 | 4 | 2|1 | 1,840 |
| 1175 Phillips Court | $1,298,000 | $1,380,000 | 14 | 3 | 1|0 | 1,000 |
| 2624 Maplewood Lane | $1,900,000 | $2,025,000 | 8 | 4 | 2|1 | 2,193 |
| 1000 Capitola Way | $1,498,000 | $1,600,000 | 12 | 4 | 2|0 | 1,845 |
| 580 Camino Drive | $1,198,000 | $1,280,000 | 10 | 3 | 2|1 | 1,348 |
| 2954 Miles Drive | $1,688,000 | $1,805,000 | 8 | 3 | 2|0 | 1,713 |
| 2250 Gianera Street | $1,449,000 | $1,550,000 | 20 | 4 | 2|1 | 2,086 |
| 3093 Millar Avenue | $1,550,000 | $1,660,000 | 10 | 3 | 2|1 | 1,534 |
| 1803 Henning Place | $1,399,000 | $1,500,000 | 28 | 4 | 3|1 | 2,406 |
| 2761 Forbes Avenue | $1,448,000 | $1,568,000 | 27 | 3 | 2|0 | 1,145 |
| 211 N Cypress Avenue | $1,499,000 | $1,625,000 | 16 | 3 | 1|0 | 1,372 |
| 145 Brian Lane | $1,798,888 | $1,970,000 | 3 | 4 | 2|0 | 1,232 |
| 2249 Lenox Place | $1,375,000 | $1,510,000 | 9 | 4 | 2|1 | 1,685 |
| 3776 Pinewood Place | $1,198,700 | $1,325,000 | 9 | 4 | 2|0 | 1,592 |
| 658 Barto Street | $1,348,888 | $1,500,000 | 17 | 4 | 2|0 | 1,092 |
| 4495 Billings Circle | $1,998,800 | $2,230,000 | 9 | 4 | 2|1 | 2,331 |
| 724 Salberg Avenue | $1,449,950 | $1,625,000 | 16 | 3 | 2|0 | 1,254 |
| 3818 Thrush Court | $1,799,000 | $2,020,000 | 9 | 4 | 2|0 | 1,568 |
| 2881 Forbes Avenue | $1,500,000 | $1,700,000 | 7 | 3 | 2|1 | 1,796 |
| 728 Clara Vista Avenue | $1,188,888 | $1,350,000 | 7 | 3 | 2|0 | 1,013 |
| 4118 Tobin Circle | $1,399,000 | $1,610,000 | 8 | 3 | 3|1 | 1,657 |
| 611 Hillsdale Avenue | $1,799,000 | $2,080,000 | 9 | 3 | 2|0 | 1,284 |
| 2867 Butte Street | $1,398,000 | $1,620,000 | 9 | 3 | 2|0 | 1,595 |
| 2664 Maplewood Lane | $2,399,950 | $2,800,000 | 13 | 4 | 3|0 | 2,735 |
| 2746 Donovan Avenue | $1,249,000 | $1,460,000 | 11 | 4 | 2|0 | 1,330 |
| 2585 Crystal Drive | $1,198,000 | $1,402,000 | 8 | 3 | 2|0 | 1,220 |
| 2944 Millar Avenue | $1,298,000 | $1,538,000 | 7 | 3 | 2|0 | 1,170 |
| 1915 De La Pena Avenue | $1,298,000 | $1,550,000 | 16 | 3 | 2|0 | 1,706 |
| 3542 Aberdeen Street | $1,199,000 | $1,450,000 | 8 | 5 | 3|0 | 1,956 |
| 2344 Fosgate Avenue | $1,099,000 | $1,357,000 | 9 | 3 | 1|0 | 1,035 |
| 1590 Newhall Street | $888,888 | $1,100,000 | 2 | 3 | 1|0 | 1,092 |
| 1176 Lincoln Street | $849,500 | $1,061,176 | 9 | 2 | 1|0 | 735 |
| 1963 Harrison Street | $999,000 | $1,258,000 | 6 | 2 | 1|0 | 1,111 |
| 2644 Maplewood Lane | $1,699,888 | $2,160,000 | 9 | 4 | 2|1 | 2,094 |
to compare with last months May 2018 home sales CLICK HERE.
Planning to sell or just want to stay on top of the market, get our professional MARKET REPORTS by Altos Research. Monitor inventory, prices, and market changes.
To Sign up for Free Market Reports:


