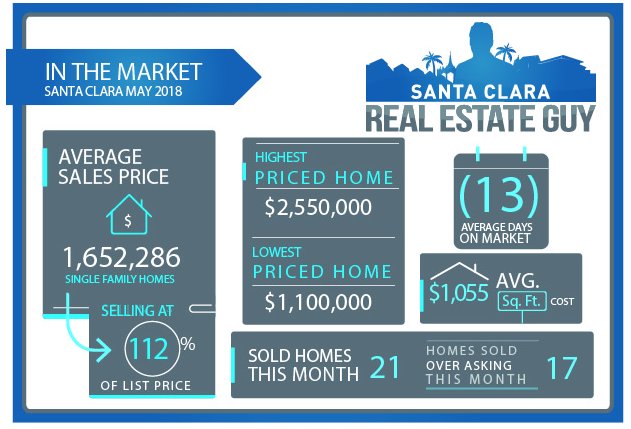
2018 Santa Clara May home sales consisted of 21 single family homes sold in Santa Clara, a large drop from 50 homes just sold in the previous month. After months of sellers receiving multiple offers and record high prices for their homes, the market has started to soften. The combination of high prices, more inventory, and increasing mortgage interest rates have slowed down buyer activity. Average days on market increased to 13 from 11 and median days on market 9. The average price of a home sold in May 2018 was $1.652M just a few thousand above last months average, but the Median price home was $1.570M, about $50K less than April’s median price. Of the 21 homes sold in May, 17 sold over asking on average 12% over asking compared to 16% over asking in the previous month. What you don’t see in this chart are the homes that are not selling on the market and have been sitting for a few weeks, something that just wasn’t happening in previous months. Next month’s number which will consist of homes that were put in contract in May, but closed in June will show significant price drops.
If you are considering selling your home, pricing it correctly is critical to avoid languishing on the market and receiving low ball offers.
| Street Address | List Price | Price | DOM | BD | BA | Sq Ft |
| 2673 Tuliptree Lane | $2,550,000 | $2,550,000 | 0 | 4 | 2|0 | 2,318 |
| 396 Grinnel Court | $1,999,888 | $2,430,000 | 5 | 3 | 2|0 | 1,508 |
| 3356 Solano Court | $1,850,000 | $2,125,000 | 8 | 5 | 3|1 | 3,137 |
| 2917 Kearney Avenue | $1,888,000 | $2,000,000 | 22 | 3 | 3|0 | 1,774 |
| 687 Valley Way | $1,695,000 | $1,950,000 | 8 | 4 | 2|0 | 1,931 |
| 412 Knowles Avenue | $1,998,000 | $1,950,000 | 54 | 5 | 4|0 | 3,628 |
| 1762 Oswald Place | $1,399,000 | $1,720,000 | 7 | 3 | 2|0 | 1,328 |
| 4370 Watson Circle | $1,498,000 | $1,681,000 | 9 | 3 | 2|1 | 2,036 |
| 4198 Tobin Circle | $1,398,000 | $1,575,000 | 10 | 3 | 3|0 | 1,590 |
| 3705 Eastwood Circle | $1,198,888 | $1,570,000 | 8 | 4 | 2|0 | 1,666 |
| 2622 Toledo Avenue | $1,450,000 | $1,570,000 | 10 | 3 | 2|0 | 1,340 |
| 1452 Heatherdale Ave | $1,698,000 | $1,550,000 | 44 | 4 | 2|0 | 1,482 |
| 2151 3rd Street | $1,299,000 | $1,500,000 | 9 | 3 | 2|1 | 1,589 |
| 3061 El Sobrante St | $1,199,950 | $1,453,000 | 13 | 2 | 1|0 | 1,162 |
| 638 Woodhams Rd | $1,448,000 | $1,420,000 | 4 | 2|0 | 1,127 | |
| 2585 Crystal Drive | $1,198,000 | $1,402,000 | 8 | 3 | 2|0 | 1,220 |
| 2371 Monroe Street | $1,299,000 | $1,365,000 | 15 | 4 | 2|0 | 1,288 |
| 2212 Francis Avenue | $1,198,000 | $1,362,000 | 8 | 3 | 2|0 | 1,078 |
| 933 Hilmar Street | $999,000 | $1,225,000 | 15 | 3 | 1|1 | 2,044 |
| 2598 Amethyst Drive | $1,050,000 | $1,200,000 | 8 | 3 | 1|0 | 897 |
| 520 Mission Street | $999,500 | $1,100,000 | 12 | 3 | 2|0 | 1,140 |
to compare with last months April 2018 home sales CLICK HERE.
Planning to sell or just want to stay on top of the market, get our professional MARKET REPORTS by Altos Research. Monitor inventory, prices, and market changes.
To Sign up for Free Market Reports:


