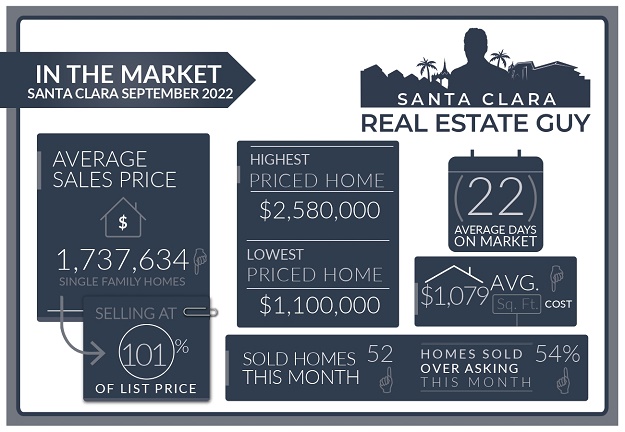
The Santa Clara housing market in September experienced 52 single-family homes that closed escrow, which is 6 more than closed escrow in the previous month of August. For some more perspective, last year there were 61 homes sold in September.
The average price of a home sold in September was $1.74M which is roughly the same as in August. The median price home sold was $1.65M, about $25K lower than the median price in August.
The average cost per square foot saw a decrease from $1116 per Sq. Ft. to $1079 per Sq. Ft. Of all the 52 homes sold in September, 28 homes sold over the list price.
On average homes that sold did so at 1.06% over asking compared to 1.36% over asking in the previous month.
We started the month of September with 32 active single-family home listings and finished with 39 active single-family homes for sale in all of Santa Clara.
For a list of sold homes in September click here or scroll down to the bottom of the page.
Market Continues to Slow
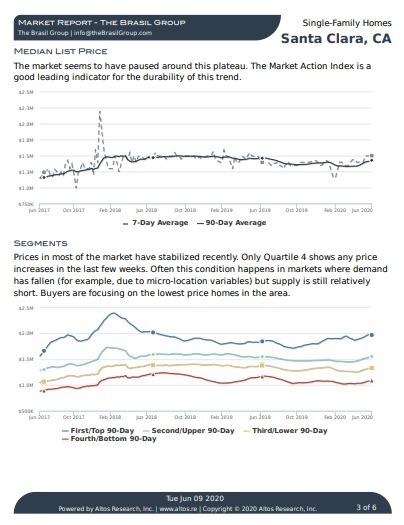
Last month’s sales numbers did not experience much change in home values.
The previous month of August saw an uptick in values from the steep home value drops in June. Unfortunately, that is not going to be the trend moving forward.
Home values were mostly unchanged in September. About half of the homes that were sold in September, sold over the list price.
Keep in mind these figures are only reporting sold homes. There are many homes sitting on the market that will likely either be canceled or reduced in price until they sell.
While the days on the market of homes sold have not changed much in the last several weeks, the days on the market of homes sitting on the market continue to increase.
Of those homes that did sell over the list price, the rate at which the homes are selling for more than their listed price is decreasing.
On our listings where we have received multiple offers, we are seeing a similar trend where offers are coming in slightly above asking and some offers under the asking price.
Altos Research Market Data For Santa Clara
Home Inventory is Increasing
We started September with 32 homes on the market and finished with 39. As of today, October 17th, there are 45 homes listed in Santa Clara.
More than half of those homes have been on the market for two weeks or more days or more.
There have been several listings that have reduced their prices, but most listings are holding firm to their original prices.
Every week inventory seems to be increasing slightly which is not typical of the market during this time of year. An indication that home-buying activity is slowing.
Santa Clara Market Reports
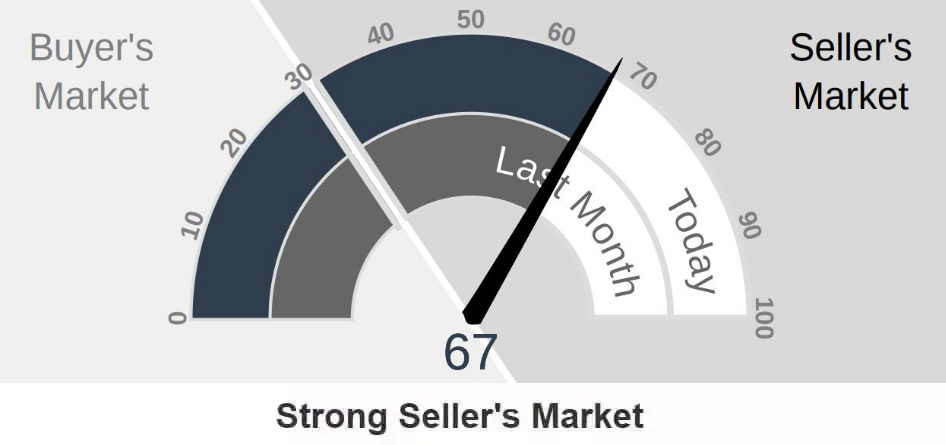
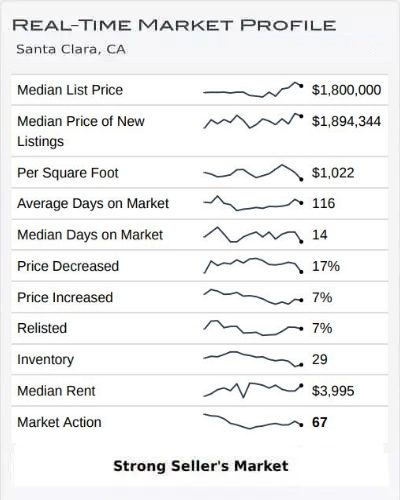
The Altos Research Market Action Index for single-family homes in Santa Clara has decreased to 67 from 68 where it was last month. For more detailed reports on Santa Clara and Santa Clara Zip codes, you can access the reports here.
Santa Clara Report
95051 Report
95050 Report
95054 Report
Multiple Offers on Some Properties
Home buyers are still actively looking at homes. Our open houses have seen a good flow of traffic. Also, the disclosure requests for homes have indicated strong interest and we are receiving multiple offers on many of our listings.
One thing to keep in mind is that our listings are priced well and presented well.
Selling your home in the current market requires either pricing very low, or aggressive marketing which includes staging and making sure the home stands out from the competition.
Many of the homes I see that are languishing on the market are overpriced or have considerable drawbacks such as location or condition.
Homes that are priced attractively and marketed well are getting strong interest and multiple offers.
If you are considering selling you may want to take a look at my video on Selling a Home in a Shifting Real Estate Market.
Other Factors in the Market:
Recent October Consumer Price Index numbers (CPI) were released and the data was not favorable.
All eyes are now on the FED on their next meeting which will be November 2-3rd and the market is expecting another .75 increase.
Interest rates have been creeping up ever so gradually with a brief pullback when the Bank of England announced a bond-buying program. Since then mortgage rates have increased above 7% on a 30-year fixed (National Average) and they don’t seem to be going down any time soon.
Markets Year to Date
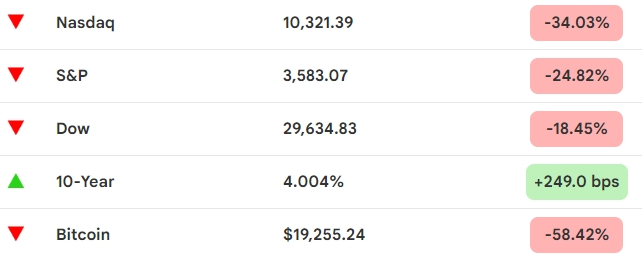
Stocks have also been selling off and are at lows for the year. Nasdaq is back to its September 2020 levels. Home buyers in our local market rely on tech stocks for their down payment and for their loan qualifications. The impact on stock values is also affecting local real estate.
Layoff announcements have started in tech and biotech. Several companies have announced hiring freezes as well as a reduction in head count. As earning season commences companies are cutting their forecasts for 2023.
Save thousands when you sell.
Includes Free Staging and Our Complete Selling Solution
* Total commission 4% including buyer side agent commission of 2.5%, offer varies by value of home.
What Can We Expect Moving Forward?
Buyers, if you are actively looking right now you are still noticing multiple offer situations on some listings.
Most buyers are proceeding cautiously and focusing on homes that fit their needs and are priced well.
Some buyers are concerned the market may crash, or prices will drop more.
The conditions of the market do not indicate a severe crash like the crash of 2008.
Most homeowners are sitting on lots of equity and those who may have purchased in the last few years although they may have lost some equity with the recent price drops, they are benefiting from very low-interest rates.
With affordability dropping as interest rates increase and stock values decline, expect to see further softening in home values.
Also, keep in mind that many sellers will choose to put off their home sales in these types of markets. Dropping inventory and limiting the quality of homes on the market.
In spite of the fears that home values will drop am encouraging my buyers to continue looking. Good properties are hard to come by in these markets and in very competitive markets very difficult to purchase. When we are dealing with local real estate, there is never a great time to buy. Timing is important but so is buying the right home.
Sellers, homes are selling and buyers are looking.
Although affordability has taken a significant drop, home values have held up and are around their Spring 2021 values.
Timing this market is going to be tricky, much of it will hinge on the FED and its policy. The challenges that the global economy is facing makes me believe that the market will drop in the coming months as we enter deeper into recession.
With that said, everyone knows the FED will at some point abandon their rate hikes, but there is no predicting the FED.
The decision to sell your home can be motivated by a number of factors. Some reasons such as trading up or downsizing of these can make a market like this market a good opportunity.
Instead of offering general suggestions here, I would encourage sellers who have questions and concerns about selling in this market to reach out to me.
Understanding your specific situation helps in determining how this market will affect you and your options. I offer free consultations to buyers and sellers to discuss their needs.
Conclusion:
As always, whether you are buying or selling, understanding the current market and how your home relates will set you up for success. As I mentioned above some homes are doing quite well in this market.
Understand that the housing stock of Santa Clara is very diverse and can vary greatly from one neighborhood to the next.
Developing the right strategy for your specific home is critical to maximizing your ability to sell for top value.
If you have any questions about a home on the market or your home’s value, please feel free to reach out, I am happy to hear from you.
Contact Me Today
Have a question? Interested in setting an appointment to talk about your real estate plans? Contact me today.

Message Me Directly:
Message Me Directly:
Santa Clara September 2022 Home Sales
| Street Address | List Price | Price | DOM | Beds Total | Bths | Sq Ft Total | Age |
| 419 Fernandez Court | $2,198,000 | $2,580,000 | 15 | 4 | 3|0 | 1,810 | 67 |
| 2635 Maplewood Lane | $2,290,000 | $2,461,000 | 8 | 3 | 3|0 | 2,224 | 52 |
| 2632 Forbes Avenue | $2,198,000 | $2,300,000 | 6 | 3 | 3|0 | 1,810 | 68 |
| 2454 Alvarado Drive | $2,198,880 | $2,300,000 | 7 | 4 | 2|1 | 2,110 | 54 |
| 3551 Elmhurst Avenue | $1,898,000 | $2,280,000 | 7 | 3 | 1|1 | 1,368 | 63 |
| 756 Purdue Court | $2,198,000 | $2,250,000 | 46 | 4 | 2|0 | 1,498 | 61 |
| 4550 Snead Drive | $2,000,000 | $2,200,000 | 70 | 5 | 4|1 | 3,230 | 62 |
| 986 Capitola Way | $1,950,000 | $2,180,000 | 5 | 4 | 2|0 | 2,447 | 57 |
| 3022 Cameron Way | $2,100,000 | $2,150,000 | 4 | 3 | 2|0 | 1,750 | 68 |
| 2974 Aspen Drive | $1,958,250 | $2,140,000 | 6 | 3 | 2|0 | 2,170 | 59 |
| 2131 Briarwood Drive | $1,999,998 | $2,130,000 | 16 | 4 | 3|0 | 2,536 | 66 |
| 3684 Londonderry Drive | $2,298,880 | $2,050,000 | 29 | 4 | 3|0 | 2,113 | 67 |
| 667 Bancroft Street | $1,799,000 | $2,030,000 | 4 | 3 | 2|1 | 2,059 | 62 |
| 2882 Sycamore Way | $1,998,880 | $2,010,000 | 5 | 3 | 2|0 | 1,442 | 62 |
| 2830 Fargher Drive | $1,798,980 | $1,935,000 | 7 | 3 | 2|1 | 2,095 | 33 |
| 594 Hickory Place | $1,899,000 | $1,931,000 | 7 | 4 | 2|0 | 1,498 | 59 |
| 3500 Butcher Drive | $1,799,000 | $1,920,000 | 6 | 3 | 2|0 | 1,488 | 48 |
| 4256 Marston Lane | $1,999,000 | $1,915,000 | 31 | 4 | 3|1 | 2,128 | 20 |
| 3023 Homestead Road | $1,849,000 | $1,850,000 | 2 | 4 | 3|0 | 1,938 | 107 |
| 639 Robin Drive | $1,999,000 | $1,850,000 | 22 | 3 | 3|0 | 1,862 | 71 |
| 355 Landeros Drive | $1,900,000 | $1,800,000 | 0 | 3 | 2|0 | 1,764 | 46 |
| 3480 Butcher Drive | $1,499,880 | $1,750,000 | 5 | 3 | 2|0 | 1,488 | 48 |
| 533 Robin Drive | $1,735,000 | $1,740,000 | 14 | 3 | 3|0 | 2,055 | 72 |
| 3023 Cameron Way | $1,799,000 | $1,725,000 | 19 | 3 | 2|0 | 1,360 | 68 |
| 2049 Kimberlin Place | $1,599,000 | $1,701,111 | 7 | 3 | 3|0 | 1,935 | 29 |
| 1215 Block Drive | $1,499,800 | $1,650,000 | 6 | 3 | 2|0 | 1,436 | 71 |
| 2116 Quinn Avenue | $1,598,000 | $1,650,000 | 5 | 4 | 2|0 | 1,315 | 63 |
| 2349 Fordham Drive | $1,599,000 | $1,650,000 | 8 | 3 | 2|0 | 1,328 | 65 |
| 3379 Vanderbilt Way | $1,800,000 | $1,620,000 | 15 | 3 | 2|0 | 1,442 | 61 |
| 1184 Inverness Avenue | $1,598,880 | $1,614,868 | 18 | 4 | 3|0 | 1,920 | 73 |
| 2423 Moraine Dr | $1,498,000 | $1,600,000 | 10 | 3 | 3|1 | 1,457 | 68 |
| 2541 Monroe Street | $1,599,000 | $1,585,000 | 39 | 4 | 2|0 | 1,728 | 50 |
| 3470 San Marcos Way | $1,698,888 | $1,570,000 | 8 | 3 | 2|0 | 1,212 | 67 |
| 2049 Larsen Court | $1,450,000 | $1,560,000 | 8 | 4 | 2|0 | 1,326 | 64 |
| 270 Crestview Drive | $1,550,000 | $1,550,000 | 28 | 4 | 2|0 | 1,504 | 66 |
| 2038 Lovell Place | $1,620,000 | $1,550,000 | 93 | 4 | 3|0 | 2,094 | 30 |
| 3375 Victoria Avenue | $1,555,000 | $1,525,000 | 78 | 3 | 2|0 | 1,080 | 68 |
| 1235 Buchanan Drive | $1,592,000 | $1,500,000 | 23 | 4 | 2|0 | 1,418 | 62 |
| 2980 Miles Drive | $1,649,000 | $1,500,000 | 32 | 3 | 2|0 | 1,098 | 63 |
| 2085 Don Court | $1,538,888 | $1,485,000 | 15 | 4 | 2|0 | 1,452 | 68 |
| 2169 Hoover Dr | $1,550,000 | $1,475,000 | 52 | 4 | 2|0 | 1,652 | 59 |
| 2703 Phillips Avenue | $1,550,000 | $1,420,000 | 33 | 3 | 2|0 | 1,576 | 66 |
| 1763 Wade Avenue | $1,398,000 | $1,350,000 | 15 | 3 | 2|0 | 1,144 | 66 |
| 478 Los Padres Boulevard | $1,498,000 | $1,350,000 | 29 | 3 | 2|0 | 1,387 | 70 |
| 779 Armanini Avenue | $1,450,000 | $1,300,000 | 30 | 3 | 2|0 | 1,532 | 72 |
| 2340 Regina Court | $1,249,000 | $1,289,000 | 8 | 3 | 2|0 | 1,341 | 45 |
| 442 Greenwood Drive | $1,350,000 | $1,280,000 | 23 | 4 | 2|0 | 1,666 | 53 |
| 2109 Main Street | $1,299,000 | $1,275,000 | 78 | 3 | 2|0 | 1,576 | 68 |
| 1273 Blackfield Drive | $1,339,000 | $1,275,000 | 39 | 3 | 2|0 | 1,134 | 68 |
| 1482 Eisenhower Dr | $1,168,000 | $1,230,000 | 6 | 4 | 2|0 | 1,095 | 62 |
| 2330 Park Avenue | $1,288,000 | $1,225,000 | 43 | 2 | 2|1 | 1,622 | 46 |
| 1224 Sherwood Avenue | $1,169,000 | $1,100,000 | 43 | 2 | 1|0 | 744 | 29 |
Santa Clara Housing Market Archive
September 2022 home sales CLICK HERE.
August 2022 home sales CLICK HERE.
July 2022 home sales CLICK HERE.
June 2022 home sales CLICK HERE.
April 2022 home sales CLICK HERE.
March 2022 home sales CLICK HERE.
February 2022 home sales CLICK HERE.
December 2021 home sales CLICK HERE.
November 2021 home sales CLICK HERE.
October 2021 home sales CLICK HERE.
September 2021 home sales CLICK HERE.
July 2021 home sales CLICK HERE.
May 2021 home sales CLICK HERE.
April 2021 home sales CLICK HERE.
March 2021 home sales CLICK HERE.
February 2021 home sales CLICK HERE.
January 2021 home sales CLICK HERE.
November 2020 home sales CLICK HERE.
October 2020 home sales CLICK HERE.
September 2020 home sales CLICK HERE.
August 2020 home sales CLICK HERE.
July 2020 home sales CLICK HERE.
June 2020 home sales CLICK HERE.
May 2020 home sales CLICK HERE.
April 2020 home sales CLICK HERE.
March 2020 home sales CLICK HERE.
January 2020 home sales CLICK HERE.
