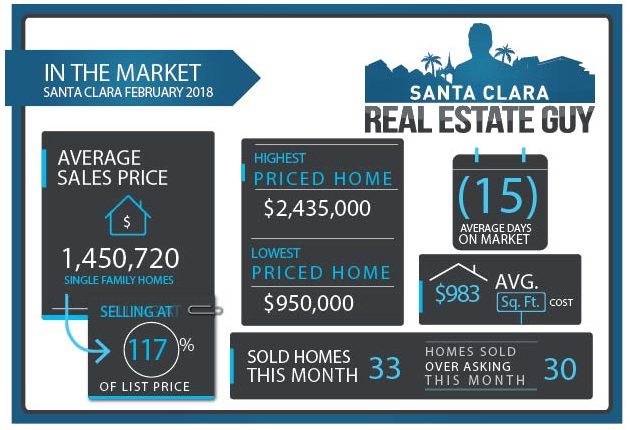
2018 February Home Sales for Santa Clara saw 33 single family homes sold in Santa Clara. Sellers continue to receive record prices for their homes with the highest priced sale being $2,435,000 and lowest price home sold for $950,000. Average days on market were 14.9 and median days on market 8. The average price of a home sold in February 2018 was $1.678M ($1.650 MEDIAN) with an average price per sq. ft of $982.58 ($949.05 MEDIAN). Of the 33 homes sold in February, thirty of them sold for more than asking price. The very low inventory for the season has resulted in a very unbalanced market. We are seeing multiple offers on virtually all homes. Homes that are priced right continue to sell quickly for record prices. If you are considering selling your home, contact me and we can sit down and discuss your options and outline a plan, now is the time.
| Street Address | Sale Price | % Over | DOM | BD | BA | Sq Ft |
| 620 Park Court | $950,000 | 6% | 7 | 2 | 1|0 | 1,001 |
| 2289 Newhall Street | $1,170,000 | 26% | 9 | 3 | 1|0 | 1,110 |
| 2287 Dolores Avenue | $1,300,000 | 32% | 10 | 3 | 2|0 | 1,371 |
| 1975 Los Padres Boulevard | $1,400,000 | 19% | 7 | 3 | 2|0 | 1,181 |
| 2809 Forbes Avenue | $1,480,000 | 14% | 5 | 3 | 2|0 | 1,254 |
| 718 Frederick Avenue | $1,483,000 | 15% | 2 | 3 | 1|1 | 1,678 |
| 2143 Kingsbury Circle | $1,486,000 | 25% | 8 | 4 | 2|1 | 1,705 |
| 2153 Esperanca Avenue | $1,500,000 | 16% | 10 | 4 | 2|1 | 1,685 |
| 547 Woodstock Way | $1,500,000 | 15% | 8 | 3 | 2|0 | 1,768 |
| 1750 Jones Avenue | $1,500,000 | 7% | 5 | 3|0 | 2,060 | |
| 657 Los Padres Boulevard | $1,530,000 | 2% | 19 | 4 | 3|0 | 1,605 |
| 1129 Las Palmas Drive | $1,576,000 | 32% | 10 | 3 | 2|0 | 1,424 |
| 1247 Las Palmas Drive | $1,600,000 | 14% | 1 | 3 | 2|0 | 1,414 |
| 1485 Farmer Place | $1,600,000 | -3% | 45 | 4 | 4|0 | 1,998 |
| 2679 Brady Court | $1,650,000 | 38% | 13 | 3 | 2|1 | 1,966 |
| 462 Cypress Ave | $1,650,000 | 19% | 3 | 2|0 | 1,560 | |
| 2029 Brown Court | $1,650,000 | 18% | 3 | 5 | 4|0 | 1,767 |
| 2356 Roosevelt Circle | $1,655,000 | 39% | 8 | 4 | 2|0 | 1,288 |
| 634 Nicholson Avenue | $1,670,000 | 13% | 8 | 3 | 2|0 | 1,254 |
| 3394 Londonderry Drive | $1,680,000 | 12% | 3 | 3 | 2|0 | 1,827 |
| 2687 Phillips Avenue | $1,730,000 | 33% | 9 | 4 | 2|0 | 1,589 |
| 678 Robin Drive | $1,750,000 | 26% | 9 | 3 | 2|0 | 1,744 |
| 721 Woodhams Road | $1,760,000 | 30% | 7 | 3 | 2|0 | 1,206 |
| 160 Kit Carson Court | $1,760,000 | 30% | 6 | 4 | 2|0 | 1,670 |
| 2799 Rebeiro Avenue | $1,770,000 | 1% | 20 | 5 | 3|0 | 2,280 |
| 3410 Victoria Avenue | $1,786,000 | 32% | 8 | 4 | 2|0 | 1,464 |
| 2643 Ralston Court | $1,850,000 | 33% | 9 | 3 | 2|0 | 1,467 |
| 2552 Pebble Beach Drive | $1,900,000 | -5% | 77 | 5 | 3|0 | 2,813 |
| 491 Magnolia Lane | $1,950,000 | 16% | 8 | 4 | 2|1 | 1,810 |
| 124 Tyler Avenue | $2,065,000 | -10% | 71 | 5 | 3|0 | 3,254 |
| 266 Douglane Avenue | $2,258,000 | 0% | 52 | 4 | 3|1 | 2,771 |
| 4188 Farrell Way | $2,350,000 | 0% | 0 | 4 | 3|1 | 3,395 |
| 137 Cypress Avenue | $2,435,000 | 6% | 9 | 4 | 3|1 | 3,164 |
compare with January 2018 home sales CLICK HERE.
To get weekly updates on the local or surround housing market, please sign up for FREE MARKET REPORTS.
To Sign up for Free Market Reports:


